


These are the best, worst cities for commuting by stress level

If you drive to work, it might be time to move to the western parts of the U.S., according to experts.
The wellness organization known as Sleep Help conducted a study that analyzed commutes by stress level. In its findings, the organization found commutes are getting longer and more drivers are hitting the road during peak hours.
One study the report cited by Robert Half, found that nearly one-quarter of workers have even left a job due to a bad commute. With an estimate of 85.3 percent of workers commuting by car, that’s a significant portion of people quitting over undesirable routes.
To get to the bottom of what makes a commute stressful, Sleep Help analyzed data from the U.S. Census Bureau and Allstate’s America’s Best Drivers Report. What the analysis found include populations migrating away from city centers, traffic congestion and impaired driver safety—all of which, subsequently lengthen drive times.

A woman drives in this stock photo. (iStock)
Sleep Help broke down its stress metric with the following factors: Population, average one-way commute time, average annual days with precipitation, relative collision likelihood and percentage of workers who drive.
Overall, researchers at Sleep Help found that major cities on the East and West Coasts had the most stressful commutes with long travel times, crowded roads and sometimes frequent rain. Cities in the Southwest had least stressful commutes—which may have something to do with drier weather conditions and shorter commute times. Arizona appears on the list an astounding five times.
Here are the most and least stressful cities for commuters, according to Sleep Help.
Cities with the most stressful commutes
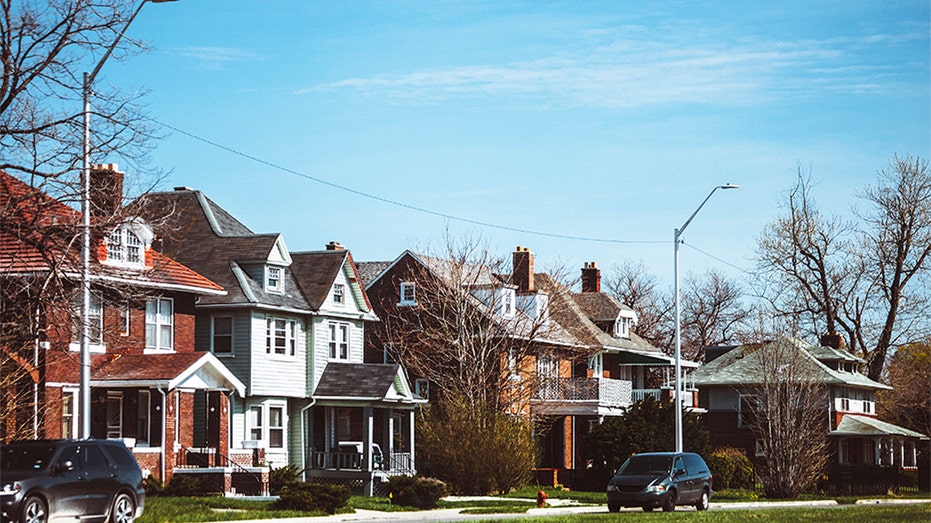
Detroit, Michigan, USA - streets of east side Detroit.
1. Detroit, M.I.
- Population: 673,103
- Average one-way commute time: 25.4 minutes
- Average annual days with precipitation: 135 days
- Relative collision likelihood: 22.9 percent above average
- Percentage of workers who drive: 83.0 percent
2. Miramar, F.L.
- Population: 140,323
- Average one-way commute time: 31.0 minutes
- Average annual days with precipitation: 145 days
- Relative collision likelihood: 18.8 percent above average
- Percentage of workers who drive: 83.9 percent
3. Paterson, N.J.
- Population: 148,678
- Average one-way commute time: 24.3 minutes
- Average annual days with precipitation: 123 days
- Relative collision likelihood: 33.8 percent above average
- Percentage of workers who drive: 84.7 percent
4. Fremont, C.A.
- Population: 234,954
- Average one-way commute time: 34.9 minutes
- Average annual days with precipitation: 65 days
- Relative collision likelihood: 40.9 percent above average
- Percentage of workers who drive: 83.0 percent
5. Bellevue, W.A.
- Population: 144,459
- Average one-way commute time: 23.8 minutes
- Average annual days with precipitation: 157 days
- Relative collision likelihood: 27.3 percent above average
- Percentage of workers who drive: 75.0 percent
6. Pembroke Pines, F.L.
- Population: 170,703
- Average one-way commute time: 31.8 minutes
- Average annual days with precipitation: 122 days
- Relative collision likelihood: 16.2 percent above average
- Percentage of workers who drive: 94.9 percent
7. Glendale, C.A.
- Population: 203,066
- Average one-way commute time: 27.9 minutes
- Average annual days with precipitation: 43 days
- Relative collision likelihood: 99.4 percent above average
- Percentage of workers who drive: 85.3 percent
- Diversity of times that people leave for work: Worse than average
8. Baltimore, M.D.
- Population: 611,648
- Average one-way commute time: 31.6 minutes
- Average annual days with precipitation: 116 days
- Relative collision likelihood: 151.7 percent above average
- Percentage of workers who drive: 67.3 percent
9. San Jose, C.A.
- Population: 1,035,353
- Average one-way commute time: 31.3 minutes
- Average annual days with precipitation: 108 days
- Relative collision likelihood: 44.8 percent above average
- Percentage of workers who drive: 87.3 percent
10. Tacoma, W.A.
- Population: 213,426
- Average one-way commute time: 30.6 minutes
- Average annual days with precipitation: 149 days
- Relative collision likelihood: 33.8 percent above average
- Percentage of workers who drive: 84.0 percent
Cities with the least stressful commutes

Downtown Scottsdale and suburbs of Phoenix, Arizona, with the White Tank Mountain Range in the background
1. Mesa, A.Z.
- Population: 496,395
- Average one-way commute time: 24.7 minutes
- Average annual days with precipitation: 35 days
- Relative collision likelihood: 8.9 percent below average
- Percentage of workers who drive: 77.3 percent
2. Scottsdale, A.Z.
- Population: 249,947
- Average one-way commute time: 22.8 minutes
- Average annual days with precipitation: 30 days
- Relative collision likelihood: 8.9 percent below average
- Percentage of workers who drive: 88.4 percent
3. Tucson, A.Z.
- Population: 535,676
- Average one-way commute time: 22.3 minutes
- Average annual days with precipitation: 51 days
- Relative collision likelihood: 1.2 percent below average
- Percentage of workers who drive: 87.8 percent
4. Chandler, A.Z.
- Population: 253,448
- Average one-way commute time: 24.8 minutes
- Average annual days with precipitation: 28 days
- Relative collision likelihood: 5.6 percent below average
- Percentage of workers who drive: 89.7 percent
5. Brownsville, T.X.
- Population: 183,292
- Average one-way commute time: 21.1 minutes
- Average annual days with precipitation: 72 days
- Relative collision likelihood: 29.1 percent below average
- Percentage of workers who drive: 89.0 percent
6. Gilbert, A.Z.
- Population: 242,362
- Average one-way commute time: 28.3 minutes
- Average annual days with precipitation: 30 days
- Relative collision likelihood: 1.2 percent below average
- Percentage of workers who drive: 94.6 percent
7. Overland Park, K.S.
- Population: 191,263
- Average one-way commute time: 20.0 minutes
- Average annual days with precipitation: 66 days
- Relative collision likelihood: 14.8 percent below average
- Percentage of workers who drive: 87.8 percent
8. Reno, N.V.
- Population: 248,860
- Average one-way commute time: 20.4 minutes
- Average annual days with precipitation: 51 days
- Relative collision likelihood: 6.5 percent below average
- Percentage of workers who drive: 84.2 percent
9. McAllen, T.X.
- Population: 142,699
- Average one-way commute time: 18.4 minutes
- Average annual days with precipitation: 48 days
- Relative collision likelihood: 14.8 percent below average
- Percentage of workers who drive: 82.8 percent
10. Fort Collins, C.O.
- Population: 165,089
- Average one-way commute time: 20.6 minutes
- Average annual days with precipitation: 87 days
- Relative collision likelihood: 16.1 percent below average
- Percentage of workers who drive: 87.7 percent