


April's job report in 3 charts - and key highlights

No April showers reported in Friday's job report.
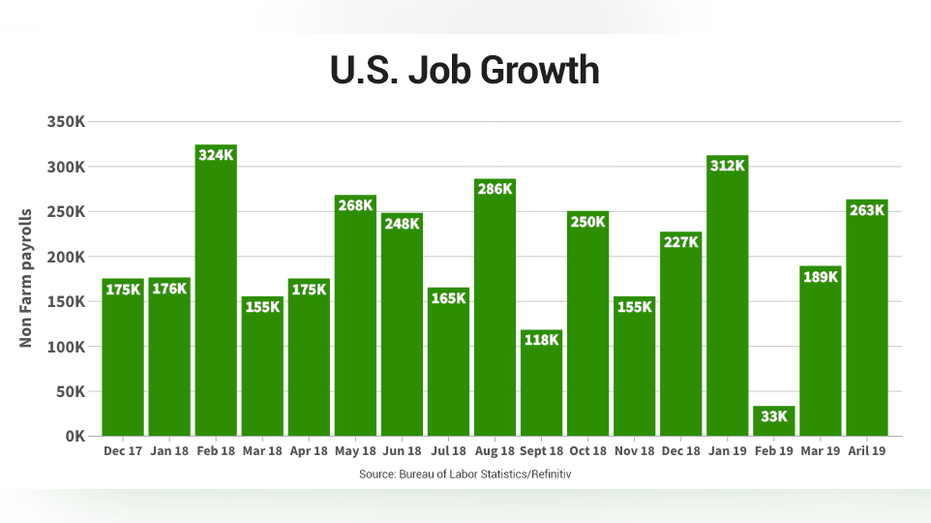
Instead, the U.S. economy added a whopping 263,000 jobs last month, blowing by Wall Street's expectations of 185,000 jobs, bringing unemployment to its lowest level since 1969.
Wall Street celebrated the news as stocks ticked upwards Friday.
Here are some of the key highlights from April's job report.
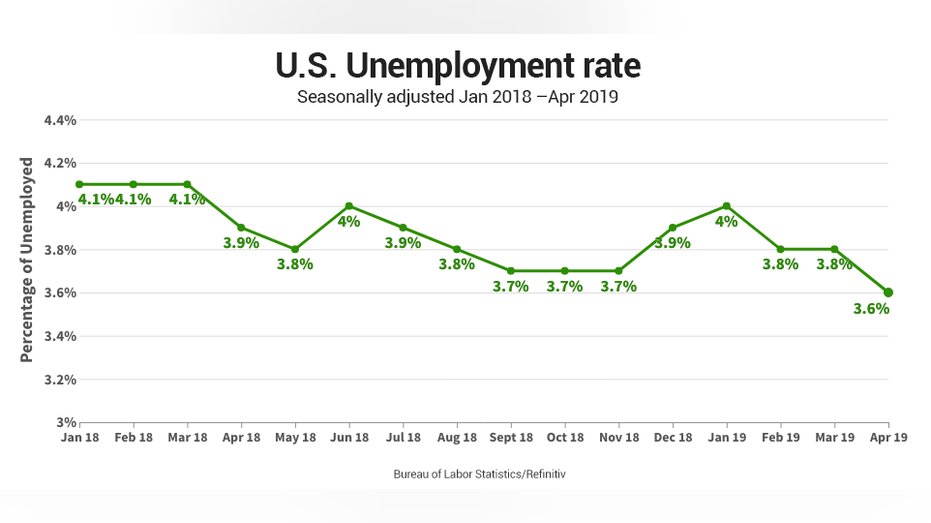
1. Unemployment rate at a 50-year low
The unemployment rate fell to 3.6 percent in April, the lowest rate since December 1969.
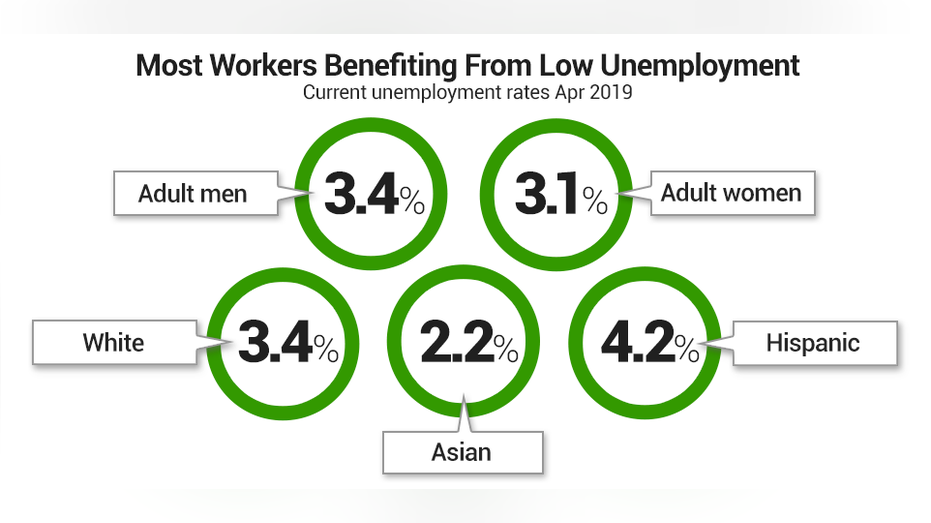
2. Most workers benefiting from low unemployment
The unemployment rates declined in April for adult men (3.4 percent), adult women (3.1 percent), Whites (3.1 percent), Asians (2.2 percent), and Hispanics (4.2 percent).
3. Where the jobs grow the most
The business and professional services sector grew at the strongest level by adding 76,000 jobs last month. Followed by the health care and educations sectors, which created 62,000 new opportunities.
4. Retail trade declined
On the flip side, retail trade employment continues to fall drastically, shedding another 12,000 jobs following a loss of 15,000 jobs in March.
5. The number of job losers also declined
According to the report, the number of job losers and persons who completed temporary jobs declined by 186,000 over the month to 2.7 million.