Difference Between Return on Equity and Internal Rate of Return

Return on equity, abbreviated as ROE, and internal rate of return, or IRR, are both figures that describe returns that can impact a shareholder's investment. But they're not the same thing.
Simply put, ROE is the total amount of return that shareholders, as a group, receive on their original investment. IRR, in contrast, shows the annualized return of an investment over any period of time.
What is ROE? ROE is a popular metric for investors due to its power to describe a company's profitability, asset management strength, and financial leverage-- all in one number. The ratio is calculated by dividing net earnings by shareholder equity.
You can find net earnings in a company's statement of income, while shareholder equity is found on the balance sheet. Divide the former by the latter, and you'll get a percentage that shows how much profit was generated from the base of equity that a business started with.
A persistently high ROE figure, relative to peers, suggests that a company enjoys competitive advantages, such as brand power or economies of scale, that can contribute to above-market stock-price returns over the long term. It tells us that a company is producing substantial operating profits and, instead of requiring more investments every year to keep running, it generates excess cash that can be employed in growing the business -- or sent back to shareholders as dividends.
Yet, as useful as it is in determining the strength of an investment candidate, ROE doesn't tell you anything about the actual return you received -- or can expect to receive -- on your stock purchase.
What is IRR? For that, investors can look to the internal rate of return. The IRR involves adding up the periodic cash flows from an investment, and calculating the annualized rate of return. Its biggest value comes from its expression of return as a function of time.
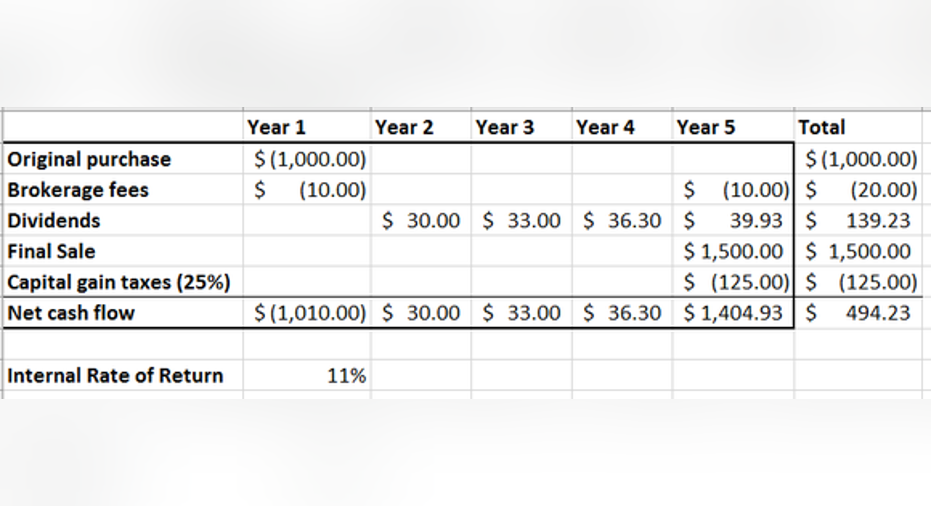
That benefit is best illustrated through an example. Let's say you buy a stock for $1,000, hold it for five years while collecting dividends, and then sell it for $1,500. Here's what a complete IRR calculation might look like:
In year one, your cash flow is -$1,010.00, comprised of the $1,000 you paid for the stock, and $10 in brokerage fees. In years two through four, cash flow only consists of dividend payments, which start off at a 3% yield, and grow by 10% annually.
In the final year, you sell the stock for 50% above what you paid for it (nice job), while also collecting a dividend. Meanwhile, taxes and brokerage fees are detracted from that year's cash flow. Add it all up, and you have $494, or 49%, more in year five then you started with.
The IRR calculation takes those annual cash flows and expresses them all as a single return. In this case, the number that Excel gives us is 11%, meaning that this investment produced 11% annualized returns over five years.
That figure is useful in comparing against other investments that you could have made, or in comparing against the return of the stock market. If, for example, the market rose by an annualized 9% during that time period, an 11% IRR demonstrates that this stock investment was a worthwhile use of cash in comparison to an index fund.
You can also use an IRR spreadsheet like this to estimate your likely return for a stock investment. And if the IRR number isn't big enough, it can inform your decision as to whether or not to direct cash to that investment.
This article is part of The Motley Fool's Knowledge Center, which was created based on the collected wisdom of a fantastic community of investors based in theFoolsaurus. Pop on over there to learn more about our Wiki andhow you can be involvedin helping the world invest, better! If you see any issues with this page, please email us atknowledgecenter@fool.com. Thanks -- and Fool on!
The article Difference Between Return on Equity and Internal Rate of Return originally appeared on Fool.com.
Try any of our Foolish newsletter services free for 30 days. We Fools may not all hold the same opinions, but we all believe that considering a diverse range of insights makes us better investors. The Motley Fool has a disclosure policy.
Copyright 1995 - 2015 The Motley Fool, LLC. All rights reserved. The Motley Fool has a disclosure policy.


