About adobe inc. - ADBE
ADBE At a Glance
| Phone | 1-408-536-6000 | Revenue | 23.77B | |
| Industry | Packaged Software | Net Income | 7.13B | |
| Sector | Technology Services | 2025 Sales Growth | 10.416% | |
| Fiscal Year-end | 11 / 2026 | Employees | 31,360 | |
| View SEC Filings |
ADBE Valuation
| P/E Current | 16.133 |
| P/E Ratio (with extraordinary items) | N/A |
| P/E Ratio (without extraordinary items) | 19.172 |
| Price to Sales Ratio | 5.751 |
| Price to Book Ratio | 11.375 |
| Price to Cash Flow Ratio | 13.63 |
| Enterprise Value to EBITDA | 14.349 |
| Enterprise Value to Sales | 5.754 |
| Total Debt to Enterprise Value | 0.049 |
ADBE Efficiency
| Revenue/Employee | 757,876.276 |
| Income Per Employee | 227,359.694 |
| Receivables Turnover | 9.194 |
| Total Asset Turnover | 0.796 |
ADBE Liquidity
| Current Ratio | 0.971 |
| Quick Ratio | 0.971 |
| Cash Ratio | 0.647 |
ADBE Profitability
| Gross Margin | 88.606 |
| Operating Margin | 36.656 |
| Pretax Margin | 36.748 |
| Net Margin | 30.00 |
| Return on Assets | 23.876 |
| Return on Equity | 55.426 |
| Return on Total Capital | 39.024 |
| Return on Invested Capital | 38.77 |
ADBE Capital Structure
| Total Debt to Total Equity | 57.197 |
| Total Debt to Total Capital | 36.386 |
| Total Debt to Total Assets | 22.539 |
| Long-Term Debt to Equity | 56.534 |
| Long-Term Debt to Total Capital | 35.964 |
Adobe Inc. in the News

Want to work in Big Tech? Here are companies with the fastest (and slowest) hiring processes
Landing a job in Big Tech can be a rigorous process. A new study ranked America's tech giants according to how long it takes between a candidate's first interview and receiving an offer.
FTC sues Adobe for allegedly hiding fees, making it tough to cancel subscriptions
The Federal Trade Commission is suing Adobe and two of the company's executives, claiming the Photoshop maker hides hefty termination fees and makes it tough for customers to cancel.
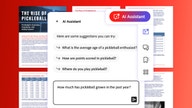
Adobe releases Acrobat AI assistant starting at $4.99 per month
Adobe's new Acrobat AI Assistant will be generally available to users of Acrobat and Reader starting on Tuesday for an add-on subscription of $4.99 per month as an early access rate.
IBM deploying Adobe Firefly generative AI tool for marketing, design teams
IBM announced Wednesday that it is deploying the Adobe Firefly generative AI tool across its design and marketing teams for internal projects as well as consulting clients on its use.

Black Friday online sales reach record level, according to Adobe Analytics
Online shoppers who took advantage of Black Friday spent enough with retailers to set a new record this year, according to Adobe Analytics.

Adobe unveils new Firefly generative AI tools for creative platforms
Adobe's next-generation Firefly generative AI models will be integrated into Creative Cloud applications to help creators produce content that's safe for commercial use.

Adobe tells Congress to give artists the right to block AI from training on their creative works
Members of the House were told by a top Adobe official that the company supports new rights for artists so their works aren't stolen or copied by AI.

Corporate diversity policies may face scrutiny after Supreme Court's affirmative action ruling
The Supreme Court's ruling rejecting the use of affirmative action and consideration of race as a factor in college admissions could prompt challenges to companies' diversity programs.

Adobe rolling out free version of Photoshop
Adobe has begun rolling out a free version of Photoshop, which will offer core functions to users who may be interested in signing up for a subscription.

Thanksgiving Day consumers to spend up to $5.9B shopping online: Adobe
Consumers shopping online have spent $76 billion in November so far, surpassing last year's $63 billion in revenue generated during the same period, according to the latest data from Adobe Analytics.