build a bear workshop inc - BBW

BBW

Close Chg Chg %
38.30 -2.18 -5.69%

Closed Market

36.12

-2.18 (5.69%)

Volume: 210.07K

Last Updated:

Mar 28, 2025, 3:59 PM EDT

Company Overview: build a bear workshop inc - BBW

BBW Key Data

Open

$37.82

Day Range

35.67 - 38.05

52 Week Range

23.63 - 48.23

Market Cap

$515.02M

Shares Outstanding

13.44M

Public Float

12.90M

Beta

1.48

Rev. Per Employee

N/A

P/E Ratio

10.14

EPS

$3.83

Yield

207.68%

Dividend

$0.22

EX-DIVIDEND DATE

Mar 27, 2025

SHORT INTEREST

N/A

AVERAGE VOLUME

316.18K


BBW Performance

1 Week
 
-3.16%
 
1 Month
 
-11.66%
 
3 Months
 
-22.54%
 
1 Year
 
21.02%
 
5 Years
 
2,342.57%
 

BBW Analyst Ratings

  • Sell
  • Under
  • Hold
  • Over
  • Buy
Number of Ratings 3
Full Ratings ➔

About build a bear workshop inc - BBW

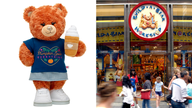
Build-A-Bear Workshop, Inc. engages in the provision of interactive retail-entertainment experiences. It operates through the following segments: Direct-To-Consumer (DTC), Commercial, and International Franchising. The DTC segment includes corporately managed locations and other retail delivery operations including e-commerce sites and temporary stores. The Commercial segment focuses on wholesale product selling and licensing intellectual property for third-party use. The International Franchising segment is involved in royalties, product, and fixture sales from other international operations under franchise agreements. The company was founded by Maxine K. Clark in September 1997 and is headquartered in St. Louis, MO.

BBW At a Glance

Build-A-Bear Workshop, Inc.
415 South 18th Street
St. Louis, Missouri 63103
Phone 1-314-423-8000 Revenue 496.40M
Industry Specialty Stores Net Income 51.79M
Sector Retail Trade 2025 Sales Growth 2.117%
Fiscal Year-end 01 / 2026 Employees N/A
View SEC Filings

BBW Valuation

P/E Current 10.137
P/E Ratio (with extraordinary items) N/A
P/E Ratio (without extraordinary items) 10.442
Price to Sales Ratio 1.089
Price to Book Ratio N/A
Price to Cash Flow Ratio N/A
Enterprise Value to EBITDA 7.523
Enterprise Value to Sales 1.228
Total Debt to Enterprise Value 0.159

BBW Efficiency

Revenue/Employee N/A
Income Per Employee N/A
Receivables Turnover 30.84
Total Asset Turnover 1.692

BBW Liquidity

Current Ratio 1.591
Quick Ratio 0.712
Cash Ratio 0.35

BBW Profitability

Gross Margin 54.898
Operating Margin 13.352
Pretax Margin 13.525
Net Margin 10.432
Return on Assets 17.654
Return on Equity 38.539
Return on Total Capital 21.936
Return on Invested Capital 26.121

BBW Capital Structure

Total Debt to Total Equity 69.74
Total Debt to Total Capital 41.086
Total Debt to Total Assets 33.452
Long-Term Debt to Equity 50.441
Long-Term Debt to Total Capital 29.717
  • Income Statement
  • Balance Sheet
  • Cash Flow Statement

Annual Financials for Build A Bear Workshop Inc - BBW

Collapse All in section
All values USD millions. 2022 2023 2024 2025 5-year trend
Sales/Revenue
411.52M 467.94M 486.11M 496.40M
Sales Growth
+61.19% +13.71% +3.88% +2.12%
Cost of Goods Sold (COGS) incl D&A
193.57M 222.06M 221.72M 223.89M
COGS excluding D&A
- - - -
-
Depreciation & Amortization Expense
12.28M 12.48M 13.66M 14.77M
Depreciation
- 12.28M 12.48M 13.66M
Amortization of Intangibles
- - - -
-
COGS Growth
+28.57% +14.72% -0.15% +0.98%
Gross Income
217.96M 245.87M 264.39M 272.52M
Gross Income Growth
+108.06% +12.81% +7.53% +3.07%
Gross Profit Margin
+52.96% +52.54% +54.39% +54.90%
2022 2023 2024 2025 5-year trend
SG&A Expense
168.15M 183.33M 198.89M 206.24M
Research & Development
- - - -
-
Other SG&A
168.15M 183.33M 198.89M 206.24M
SGA Growth
+43.74% +9.03% +8.49% +3.69%
Other Operating Expense
- - - -
-
Unusual Expense
- - - (1.40M)
-
EBIT after Unusual Expense
51.20M 62.54M 65.50M 66.28M
Non Operating Income/Expense
(495.00K) (600.00K) 829.00K 861.00K
Non-Operating Interest Income
- 5.00K 929.00K 861.00K
Equity in Earnings of Affiliates
- - - -
-
Interest Expense
- - - 19.00K
-
Interest Expense Growth
- - - -
-
Gross Interest Expense
- - - 19.00K
-
Interest Capitalized
- - - -
-
Pretax Income
50.71M 61.92M 66.33M 67.14M
Pretax Income Growth
+351.21% +22.11% +7.11% +1.22%
Pretax Margin
+12.32% +13.23% +13.64% +13.53%
Income Tax
3.44M 13.94M 13.52M 15.36M
Income Tax - Current - Domestic
- 10.94M 12.81M 15.29M
Income Tax - Current - Foreign
- 128.00K 30.00K 145.00K
Income Tax - Deferred - Domestic
- (7.01M) 653.00K (749.00K)
Income Tax - Deferred - Foreign
- (611.00K) 449.00K (1.16M)
Income Tax Credits
- - - -
-
Equity in Earnings of Affiliates
- - - -
-
Other After Tax Income (Expense)
- - - -
-
Consolidated Net Income
47.27M 47.98M 52.80M 51.78M
Minority Interest Expense
- - - -
-
Net Income
47.27M 47.98M 52.80M 51.78M
Net Income Growth
+305.65% +1.52% +10.04% -1.93%
Net Margin Growth
+11.49% +10.25% +10.86% +10.43%
Extraordinaries & Discontinued Operations
- - - -
-
Discontinued Operations
- - - -
-
Net Income After Extraordinaries
47.27M 47.98M 52.80M 51.78M
Preferred Dividends
- - - -
-
Net Income Available to Common
47.27M 47.98M 52.80M 51.78M
EPS (Basic)
3.0571 3.2117 3.6816 3.8137
EPS (Basic) Growth
+298.50% +5.06% +14.63% +3.59%
Basic Shares Outstanding
15.46M 14.94M 14.34M 13.58M
EPS (Diluted)
2.9316 3.1466 3.6488 3.8
EPS (Diluted) Growth
+290.35% +7.33% +15.96% +4.14%
Diluted Shares Outstanding
16.12M 15.25M 14.47M 13.62M
EBITDA
62.08M 75.03M 79.16M 81.05M
EBITDA Growth
+5,745.67% +20.85% +5.51% +2.39%
EBITDA Margin
+15.09% +16.03% +16.28% +16.33%

Snapshot

Average Recommendation BUY Average Target Price 54.333
Number of Ratings 3 Current Quarters Estimate 0.859
FY Report Date 04 / 2025 Current Year's Estimate 3.913
Last Quarter’s Earnings 1.62 Median PE on CY Estimate N/A
Year Ago Earnings 3.80 Next Fiscal Year Estimate 4.283
Median PE on Next FY Estimate N/A

Earnings Per Share

This Quarter Next Quarter This Fiscal Next Fiscal
# of Estimates 4 4 4 3
Mean Estimate 0.86 0.67 3.91 4.28
High Estimates 0.89 0.71 4.03 4.42
Low Estimate 0.84 0.62 3.80 4.09
Coefficient of Variance 2.65 6.44 3.06 4.02

Analysts Recommendations

Current 1 Month Ago 3 Months Ago
BUY 3 3 3
OVERWEIGHT 0 0 0
HOLD 0 0 0
UNDERWEIGHT 0 0 0
SELL 0 0 0
MEAN Buy Buy Buy

Insider Actions for Build A Bear Workshop Inc - BBW

Date Name Shares Transaction Value
Jan 24, 2025 Voin Todorovic Chief Financial Officer 70,695 Open market or private sale of non-derivative or derivative security Non-derivative transaction at $40.08 per share 2,833,455.60
Jan 24, 2025 J. Christopher Hurt Chief Operations Officer 43,176 Open market or private sale of non-derivative or derivative security Non-derivative transaction at $39.91 per share 1,723,154.16
Jul 19, 2024 Sharon Price John President and CEO; Director 515,004 Open market or private sale of non-derivative or derivative security Non-derivative transaction at $25.99 per share 13,384,953.96
Jun 18, 2024 Craig A. Leavitt Director 80,667 Grant, award or other acq pursuant to Rule 16b-3(d) 0.00
Jun 18, 2024 Robert L. Dixon Director 48,428 Grant, award or other acq pursuant to Rule 16b-3(d) 0.00
Jun 18, 2024 Lesli Rotenberg Director 14,197 Grant, award or other acq pursuant to Rule 16b-3(d) 0.00
Jun 18, 2024 George M. Carrara Director 20,921 Grant, award or other acq pursuant to Rule 16b-3(d) 0.00
Jun 18, 2024 Narayan R. Iyengar Director 14,197 Grant, award or other acq pursuant to Rule 16b-3(d) 0.00
May 3, 2024 Eric R. Fencl CAO, Gen. Counsel & Secretary 154,352 Payment of exercise price or tax liability by delivering/withholding secs incident to the receipt/exercise/vesting pursuant to Rule 16b-3 Non-derivative transaction at $30.16 per share 4,655,256.32
Apr 19, 2024 Sharon Price John President and CEO; Director 615,893 Grant, award or other acq pursuant to Rule 16b-3(d) 0.00

Build A Bear Workshop Inc in the News
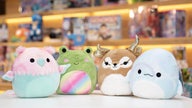