About compass inc /ny/ - COMP
COMP At a Glance
| Phone | 1-212-913-9058 | Revenue | 5.63B | |
| Industry | Packaged Software | Net Income | -154,400,000.00 | |
| Sector | Technology Services | 2024 Sales Growth | 15.232% | |
| Fiscal Year-end | 12 / 2025 | Employees | 2,566 | |
| View SEC Filings |
COMP Valuation
| P/E Current | N/A |
| P/E Ratio (with extraordinary items) | N/A |
| P/E Ratio (without extraordinary items) | N/A |
| Price to Sales Ratio | 0.521 |
| Price to Book Ratio | 7.332 |
| Price to Cash Flow Ratio | 24.15 |
| Enterprise Value to EBITDA | 617.435 |
| Enterprise Value to Sales | 0.57 |
| Total Debt to Enterprise Value | 0.155 |
COMP Efficiency
| Revenue/Employee | 2,193,725.643 |
| Income Per Employee | -60,171.473 |
| Receivables Turnover | 77.111 |
| Total Asset Turnover | 4.815 |
COMP Liquidity
| Current Ratio | 0.934 |
| Quick Ratio | 0.934 |
| Cash Ratio | 0.634 |
COMP Profitability
| Gross Margin | 10.446 |
| Operating Margin | -1.371 |
| Pretax Margin | -2.743 |
| Net Margin | -2.743 |
| Return on Assets | -13.206 |
| Return on Equity | -36.845 |
| Return on Total Capital | -17.023 |
| Return on Invested Capital | -18.959 |
COMP Capital Structure
| Total Debt to Total Equity | 121.544 |
| Total Debt to Total Capital | 54.862 |
| Total Debt to Total Assets | 42.241 |
| Long-Term Debt to Equity | 92.941 |
| Long-Term Debt to Total Capital | 41.951 |
Compass Inc /Ny/ in the News

Bing Crosby's former California desert oasis home on the market for $13.5 million
Bing Crosby's former home in California's Coachella Valley is on the market for $13.5 million. The home boasts a swimming pool and three guest casitas.

Red Hot Chili Peppers front man's former LA home on the market for $11.25M
The former Beverly Hills home of Red Hot Chili Peppers singer Anthony Kiedis is currently on the market for $11.25 million. Kiedis bought the home in 2004 and lived there until 2007.

Clint Eastwood's former California home hits the market for the first time in 28 years at $21 million
Clint Eastwood's former Carmel-by-the-Sea home is on sale for the first time in 28 years, for $21 million. The star lived there while he was mayor of the idyllic city from 1986 to 1988.

Marlo Thomas, Phil Donahue's former Connecticut estate sets record with $27.5 million listing
Marlo Thomas and Phil Donahue's former home has set the record for the most expensive home to hit the market in Connecticut at $27.5 million.

Mandy Moore lists her mid-century California home for $6M
Mandy Moore is selling her mid-century Pasadena home for $6 million. She bought the three bedroom house in 2017 and completely remodeled it with her now-husband, Taylor Goldsmith.

'Wizard of Oz' star Judy Garland's Bel-Air mansion hits market for nearly $11.5 million
Judy Garland's home is up for sale in Bel-Air for a whopping $11.495 million. It was built in the 1930's, and Garland bought the home the same year "The Wizard of Oz" premiered.

Alec Baldwin slashes Hamptons mansion price amid new indictment in deadly 'Rust' shooting
Alec Baldwin is hawking his Hamptons, New York, estate in online ads amid a new indictment in the deadly "Rust" movie set shooting of cinematographer Halyna Hutchins.
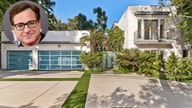
Bob Saget's former Los Angeles home sells for $5.4M
Late actor and comedian Bob Saget's Los Angeles home recently sold for $5.4 million. Saget bought the 6,608-square-foot home with six bedrooms in 2003.

NYC apartment of Hollywood legend Greta Garbo hits market for $7.25M: ‘Cinematic views'
The listing agents spoke to Fox News Digital about the history behind Hollywood legend Greta Garbo's Manhattan apartment as it goes up for sale for $7.25M.