dollar tree inc. - DLTR

DLTR

Close Chg Chg %
64.87 -1.69 -2.61%

Pre-Market

63.18

-1.69 (2.61%)

Volume: 6.03M

Last Updated:

Nov 20, 2024, 4:00 PM EDT

Company Overview: dollar tree inc. - DLTR

DLTR Key Data

Open

$64.00

Day Range

61.70 - 64.25

52 Week Range

60.49 - 151.22

Market Cap

$13.95B

Shares Outstanding

214.99M

Public Float

214.78M

Beta

0.87

Rev. Per Employee

N/A

P/E Ratio

N/A

EPS

-$4.88

Yield

0.00%

Dividend

N/A

EX-DIVIDEND DATE

SHORT INTEREST

N/A

AVERAGE VOLUME

5.35M


DLTR Performance

1 Week
 
-1.59%
 
1 Month
 
-7.36%
 
3 Months
 
-34.87%
 
1 Year
 
-46.15%
 
5 Years
 
-42.06%
 

DLTR Analyst Ratings

  • Sell
  • Under
  • Hold
  • Over
  • Buy
Number of Ratings 30
Full Ratings ➔

About dollar tree inc. - DLTR

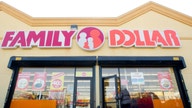
Dollar Tree, Inc. owns and operates discount variety stores offering merchandise at fixed prices. It operates through the Dollar Tree and Family Dollar segments. The Dollar Tree segment includes operations under Dollar Tree and Dollar Tree Canada brands, with its distribution centers in the United States and Canada. The Family Dollar segment consists of a chain of general merchandise retail discount stores providing consumers with a selection of competitively priced merchandise in convenient neighborhood stores. The company was founded by J. Douglas Perry and Macon F. Brock, Jr. in 1953 and is headquartered in Chesapeake, VA.

DLTR At a Glance

Dollar Tree, Inc.
500 Volvo Parkway
Chesapeake, Virginia 23320
Phone 1-757-321-5000 Revenue 30.60B
Industry Discount Stores Net Income -998,400,000.00
Sector Retail Trade 2024 Sales Growth 8.02%
Fiscal Year-end 01 / 2025 Employees 211,800
View SEC Filings

DLTR Valuation

P/E Current N/A
P/E Ratio (with extraordinary items) N/A
P/E Ratio (without extraordinary items) N/A
Price to Sales Ratio 0.995
Price to Book Ratio 4.133
Price to Cash Flow Ratio 11.342
Enterprise Value to EBITDA 26.076
Enterprise Value to Sales 1.312
Total Debt to Enterprise Value 0.259

DLTR Efficiency

Revenue/Employee 144,493.862
Income Per Employee -4,713.881
Receivables Turnover N/A
Total Asset Turnover 1.359

DLTR Liquidity

Current Ratio 1.306
Quick Ratio 0.217
Cash Ratio 0.146

DLTR Profitability

Gross Margin 30.421
Operating Margin 2.283
Pretax Margin -3.231
Net Margin -3.262
Return on Assets -4.433
Return on Equity -12.43
Return on Total Capital -5.641
Return on Invested Capital -5.94

DLTR Capital Structure

Total Debt to Total Equity 142.031
Total Debt to Total Capital 58.683
Total Debt to Total Assets 47.163
Long-Term Debt to Equity 121.343
Long-Term Debt to Total Capital 50.135
  • Income Statement
  • Balance Sheet
  • Cash Flow Statement

Annual Financials for Dollar Tree Inc. - DLTR

Collapse All in section
All values USD millions. 2021 2022 2023 2024 5-year trend
Sales/Revenue
25.51B 26.32B 28.33B 30.60B
Sales Growth
+8.04% +3.18% +7.64% +8.02%
Cost of Goods Sold (COGS) incl D&A
17.73B 18.61B 19.43B 21.29B
COGS excluding D&A
- - - -
-
Depreciation & Amortization Expense
679.20M 710.50M 767.30M 841.00M
Depreciation
631.10M 672.00M 737.40M 819.10M
Amortization of Intangibles
48.10M 38.50M 29.90M 21.90M
COGS Growth
+6.68% +4.97% +4.37% +9.61%
Gross Income
7.78B 7.71B 8.91B 9.31B
Gross Income Growth
+11.29% -0.89% +15.54% +4.54%
Gross Profit Margin
+30.48% +29.28% +31.43% +30.42%
2021 2022 2023 2024 5-year trend
SG&A Expense
5.61B 5.86B 6.63B 8.61B
Research & Development
- - - -
-
Other SG&A
5.61B 5.86B 6.63B 8.61B
SGA Growth
+4.08% +4.52% +13.16% +29.90%
Other Operating Expense
- - - -
-
Unusual Expense
283.60M 37.90M 39.90M 1.58B
EBIT after Unusual Expense
1.89B 1.81B 2.24B (881.80M)
Non Operating Income/Expense
(800.00K) (300.00K) (400.00K) (100.00K)
Non-Operating Interest Income
- - - -
-
Equity in Earnings of Affiliates
- - - -
-
Interest Expense
147.30M 178.90M 125.30M 106.80M
Interest Expense Growth
-9.13% +21.45% -29.96% -14.76%
Gross Interest Expense
150.50M 180.00M 129.10M 112.70M
Interest Capitalized
3.20M 1.10M 3.80M 5.90M
Pretax Income
1.74B 1.63B 2.11B (988.70M)
Pretax Income Growth
+58.35% -6.18% +29.31% -146.84%
Pretax Margin
+6.82% +6.20% +7.45% -3.23%
Income Tax
397.90M 304.30M 495.20M 9.70M
Income Tax - Current - Domestic
366.90M 327.40M 372.20M 268.30M
Income Tax - Current - Foreign
- 200.00K 100.00K 100.00K
Income Tax - Deferred - Domestic
28.80M (26.20M) 118.40M (264.50M)
Income Tax - Deferred - Foreign
2.00M 3.00M 4.50M 5.90M
Income Tax Credits
- - - -
-
Equity in Earnings of Affiliates
- - - -
-
Other After Tax Income (Expense)
- - - -
-
Consolidated Net Income
1.34B 1.33B 1.62B (998.40M)
Minority Interest Expense
- - - -
-
Net Income
1.34B 1.33B 1.62B (998.40M)
Net Income Growth
+62.26% -1.04% +21.65% -161.81%
Net Margin Growth
+5.26% +5.04% +5.70% -3.26%
Extraordinaries & Discontinued Operations
- - - -
-
Discontinued Operations
- - - -
-
Net Income After Extraordinaries
1.34B 1.33B 1.62B (998.40M)
Preferred Dividends
- - - -
-
Net Income Available to Common
1.34B 1.33B 1.62B (998.40M)
EPS (Basic)
5.6764 5.8267 7.2375 -4.5485
EPS (Basic) Growth
+62.81% +2.65% +24.21% -162.85%
Basic Shares Outstanding
236.40M 227.90M 223.20M 219.50M
EPS (Diluted)
5.6549 5.7987 7.2084 -4.5485
EPS (Diluted) Growth
+62.95% +2.54% +24.31% -163.10%
Diluted Shares Outstanding
237.30M 229.00M 224.10M 219.50M
EBITDA
2.85B 2.56B 3.04B 1.54B
EBITDA Growth
+27.43% -10.20% +18.90% -49.41%
EBITDA Margin
+11.18% +9.73% +10.74% +5.03%

Snapshot

Average Recommendation OVERWEIGHT Average Target Price 80.826
Number of Ratings 30 Current Quarters Estimate 2.239
FY Report Date 01 / 2025 Current Year's Estimate 5.401
Last Quarter’s Earnings 1.07 Median PE on CY Estimate N/A
Year Ago Earnings 5.89 Next Fiscal Year Estimate 6.024
Median PE on Next FY Estimate N/A

Earnings Per Share

This Quarter Next Quarter This Fiscal Next Fiscal
# of Estimates 25 13 27 27
Mean Estimate 2.24 1.53 5.40 6.02
High Estimates 2.42 1.74 5.61 6.73
Low Estimate 2.06 1.29 5.20 5.46
Coefficient of Variance 3.50 7.26 1.51 4.78

Analysts Recommendations

Current 1 Month Ago 3 Months Ago
BUY 9 11 14
OVERWEIGHT 1 1 0
HOLD 19 17 13
UNDERWEIGHT 1 1 1
SELL 0 0 0
MEAN Overweight Overweight Overweight

Insider Actions for Dollar Tree Inc. - DLTR

Date Name Shares Transaction Value
Jul 10, 2024 Lawrence J. Gatta Chief Merchandising Officer FD 28,617 Grant, award or other acq pursuant to Rule 16b-3(d) 0.00
Jul 10, 2024 Michael J. Kindy Chief Supply Chain Officer 19,787 Grant, award or other acq pursuant to Rule 16b-3(d) 0.00
Apr 5, 2024 Jeffrey G. Naylor Director 16,812 Conversion of derivative security 0.00
Apr 5, 2024 Jeffrey G. Naylor Director N/A Conversion of derivative security 0.00
Mar 21, 2024 Richard L. McNeely CMO - Dollar Tree 54,396 Grant, award or other acq pursuant to Rule 16b-3(d) 0.00
Mar 21, 2024 Richard L. McNeely CMO - Dollar Tree 51,297 Payment of exercise price or tax liability by delivering/withholding secs incident to the receipt/exercise/vesting pursuant to Rule 16b-3 Non-derivative transaction at $128.19 per share 6,575,762.43
Feb 27, 2024 Jennifer Hulett Chief Human Resources Officer 6,584 Payment of exercise price or tax liability by delivering/withholding secs incident to the receipt/exercise/vesting pursuant to Rule 16b-3 Non-derivative transaction at $145.88 per share 960,473.92
Dec 1, 2023 Jeffrey Allan Davis Chief Financial Officer 18,382 Payment of exercise price or tax liability by delivering/withholding secs incident to the receipt/exercise/vesting pursuant to Rule 16b-3 Non-derivative transaction at $117.32 per share 2,156,576.24
Dec 1, 2023 Michael C. Creedon Chief Operating Officer 12,521 Payment of exercise price or tax liability by delivering/withholding secs incident to the receipt/exercise/vesting pursuant to Rule 16b-3 Non-derivative transaction at $117.32 per share 1,468,963.72

Dollar Tree Inc. in the News