airbus se - EADSY

EADSY

Close Chg Chg %
45.41 -0.59 -1.30%

Closed Market

44.82

-0.59 (1.30%)

Volume: 266.29K

Last Updated:

Mar 28, 2025, 3:59 PM EDT

Company Overview: airbus se - EADSY

EADSY Key Data

Open

$44.95

Day Range

44.67 - 45.24

52 Week Range

34.10 - 47.50

Market Cap

$143.53B

Shares Outstanding

3.15B

Public Float

N/A

Beta

1.43

Rev. Per Employee

N/A

P/E Ratio

31.73

EPS

$1.44

Yield

77.57%

Dividend

$0.39

EX-DIVIDEND DATE

Apr 23, 2025

SHORT INTEREST

N/A

AVERAGE VOLUME

930.72K


EADSY Performance

1 Week
 
-0.24%
 
1 Month
 
3.34%
 
3 Months
 
11.11%
 
1 Year
 
-2.90%
 
5 Years
 
131.63%
 

EADSY Analyst Ratings

  • Sell
  • Under
  • Hold
  • Over
  • Buy
Number of Ratings 22
Full Ratings ➔

About airbus se - EADSY

Airbus SE is a holding and management company, which engages in the design, manufacture, and marketing of aerospace products, services, and solutions. It operates through the following segments: Airbus, Airbus Helicopters, and Airbus Defense and Space. The Airbus segment involves the development, manufacture, marketing, and sale of commercial jet passenger aircraft, regional turboprop, and components, conversion and related services. The Airbus Helicopters segment includes the provision of civil and military helicopters and related services. The Airbus Defense and Space segment focuses on connected intelligence, military air, and space systems. The company was founded on December 29, 1998 and is headquartered in Leiden, Netherland.

EADSY At a Glance

Airbus SE
Mendelweg 30
Leiden, Noord-Holland 2333 CS
Phone 31-71-524-56-00 Revenue 74.89B
Industry Aerospace & Defense Net Income 4.58B
Sector Electronic Technology 2024 Sales Growth 5.838%
Fiscal Year-end 12 / 2025 Employees 156,921
View SEC Filings

EADSY Valuation

P/E Current 31.731
P/E Ratio (with extraordinary items) N/A
P/E Ratio (without extraordinary items) 27.659
Price to Sales Ratio 1.693
Price to Book Ratio 6.221
Price to Cash Flow Ratio 15.425
Enterprise Value to EBITDA 14.874
Enterprise Value to Sales 1.645
Total Debt to Enterprise Value 0.12

EADSY Efficiency

Revenue/Employee 477,217.524
Income Per Employee 29,172.101
Receivables Turnover 6.946
Total Asset Turnover 0.565

EADSY Liquidity

Current Ratio 1.135
Quick Ratio 0.512
Cash Ratio 0.295

EADSY Profitability

Gross Margin 15.42
Operating Margin 6.939
Pretax Margin 7.331
Net Margin 6.113
Return on Assets 3.453
Return on Equity 22.975
Return on Total Capital 13.046
Return on Invested Capital 14.805

EADSY Capital Structure

Total Debt to Total Equity 72.83
Total Debt to Total Capital 42.14
Total Debt to Total Assets 11.051
Long-Term Debt to Equity 52.815
Long-Term Debt to Total Capital 30.559
  • Income Statement
  • Balance Sheet
  • Cash Flow Statement

Annual Financials for Airbus Se - EADSY

Collapse All in section
All values USD millions. 2021 2022 2023 2024 5-year trend
Sales/Revenue
61.64B 61.76B 70.75B 74.89B
Sales Growth
+8.33% +0.19% +14.57% +5.84%
Cost of Goods Sold (COGS) incl D&A
50.26B 50.65B 59.90B 63.34B
COGS excluding D&A
- - - -
-
Depreciation & Amortization Expense
2.75B 2.85B 2.42B 3.09B
Depreciation
- - - -
-
Amortization of Intangibles
- - - -
-
COGS Growth
-0.37% +0.78% +18.26% +5.75%
Gross Income
11.38B 11.11B 10.86B 11.55B
Gross Income Growth
+76.37% -2.41% -2.26% +6.34%
Gross Profit Margin
+18.47% +17.99% +15.35% +15.42%
2021 2022 2023 2024 5-year trend
SG&A Expense
5.67B 5.59B 6.25B 6.35B
Research & Development
3.25B 3.24B 3.52B 3.52B
Other SG&A
2.43B 2.35B 2.73B 2.84B
SGA Growth
-0.46% -1.43% +11.74% +1.66%
Other Operating Expense
- - - -
-
Unusual Expense
555.53M 612.72M (42.16M) 205.52M
EBIT after Unusual Expense
5.16B 4.91B 4.65B 4.99B
Non Operating Income/Expense
1.13B 718.87M 1.03B 1.47B
Non-Operating Interest Income
104.01M 189.18M 787.05M 867.52M
Equity in Earnings of Affiliates
- - - -
-
Interest Expense
394.78M 433.00M 814.08M 973.52M
Interest Expense Growth
-15.74% +9.68% +88.01% +19.59%
Gross Interest Expense
394.78M 433.00M 814.08M 973.52M
Interest Capitalized
- - - -
-
Pretax Income
5.89B 5.19B 4.87B 5.49B
Pretax Income Growth
+542.32% -11.90% -6.27% +12.79%
Pretax Margin
+9.56% +8.41% +6.88% +7.33%
Income Tax
1.01B 986.86M 1.25B 1.46B
Income Tax - Current - Domestic
411.33M 563.32M 964.36M 1.17B
Income Tax - Current - Foreign
- - - -
-
Income Tax - Deferred - Domestic
596.90M 423.54M 285.41M 287.73M
Income Tax - Deferred - Foreign
- - - -
-
Income Tax Credits
- - - -
-
Equity in Earnings of Affiliates
- - - -
-
Other After Tax Income (Expense)
- - - -
-
Consolidated Net Income
4.93B 4.35B 3.91B 4.41B
Minority Interest Expense
(46.10M) (116.66M) (190.28M) (166.58M)
Net Income
4.98B 4.46B 4.10B 4.58B
Net Income Growth
+485.55% -10.37% -8.23% +11.75%
Net Margin Growth
+8.08% +7.23% +5.79% +6.11%
Extraordinaries & Discontinued Operations
- - - -
-
Discontinued Operations
- - - -
-
Net Income After Extraordinaries
4.98B 4.46B 4.10B 4.58B
Preferred Dividends
- - - -
-
Net Income Available to Common
4.98B 4.46B 4.10B 4.58B
EPS (Basic)
1.5852 1.4177 1.2984 1.4487
EPS (Basic) Growth
+484.48% -10.57% -8.42% +11.58%
Basic Shares Outstanding
3.14B 3.15B 3.15B 3.16B
EPS (Diluted)
1.5841 1.4165 1.2967 1.4468
EPS (Diluted) Growth
+484.21% -10.58% -8.46% +11.58%
Diluted Shares Outstanding
3.14B 3.15B 3.16B 3.16B
EBITDA
8.46B 8.37B 7.04B 8.28B
EBITDA Growth
+112.35% -1.02% -15.98% +17.72%
EBITDA Margin
+13.73% +13.56% +9.94% +11.06%

Snapshot

Average Recommendation OVERWEIGHT Average Target Price 50.607
Number of Ratings 22 Current Quarters Estimate 0.15
FY Report Date 03 / 2025 Current Year's Estimate 1.785
Last Quarter’s Earnings 0.639 Median PE on CY Estimate N/A
Year Ago Earnings 1.374 Next Fiscal Year Estimate 2.186
Median PE on Next FY Estimate N/A

Earnings Per Share

This Quarter Next Quarter This Fiscal Next Fiscal
# of Estimates 2 2 18 17
Mean Estimate 0.15 0.44 1.78 2.19
High Estimates 0.18 0.47 1.91 2.30
Low Estimate 0.12 0.42 1.68 2.08
Coefficient of Variance 27.82 8.85 4.15 2.60

Analysts Recommendations

Current 1 Month Ago 3 Months Ago
BUY 12 12 14
OVERWEIGHT 5 5 6
HOLD 4 3 1
UNDERWEIGHT 0 0 0
SELL 1 2 2
MEAN Overweight Overweight Overweight

Airbus Se in the News
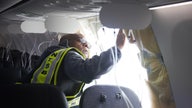
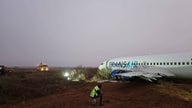
Boeing jet skids off runway, injuring at least 10

A Boeing 737 skidded off a runway at an airport in Senegal’s capital on Thursday. The Air Senegal flight operated by TransAir was headed from Dakar to the city of Bamako in Mali when the jet exited the runway during takeoff.
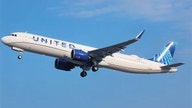