About hormel foods corp. - HRL
HRL At a Glance
| Phone | 1-507-437-5611 | Revenue | 12.11B | |
| Industry | Food: Meat/Fish/Dairy | Net Income | 478.20M | |
| Sector | Consumer Non-Durables | 2025 Sales Growth | 1.555% | |
| Fiscal Year-end | 10 / 2026 | Employees | 20,000 | |
| View SEC Filings |
HRL Valuation
| P/E Current | 28.18 |
| P/E Ratio (with extraordinary items) | N/A |
| P/E Ratio (without extraordinary items) | 27.432 |
| Price to Sales Ratio | 1.084 |
| Price to Book Ratio | 1.659 |
| Price to Cash Flow Ratio | 15.52 |
| Enterprise Value to EBITDA | 13.567 |
| Enterprise Value to Sales | 1.277 |
| Total Debt to Enterprise Value | 0.196 |
HRL Efficiency
| Revenue/Employee | 605,308.00 |
| Income Per Employee | 23,909.85 |
| Receivables Turnover | 13.732 |
| Total Asset Turnover | 0.903 |
HRL Liquidity
| Current Ratio | 2.466 |
| Quick Ratio | 1.201 |
| Cash Ratio | 0.51 |
HRL Profitability
| Gross Margin | 15.453 |
| Operating Margin | 7.23 |
| Pretax Margin | 5.48 |
| Net Margin | 3.95 |
| Return on Assets | 3.565 |
| Return on Equity | 6.017 |
| Return on Total Capital | 4.376 |
| Return on Invested Capital | 4.377 |
HRL Capital Structure
| Total Debt to Total Equity | 38.291 |
| Total Debt to Total Capital | 27.689 |
| Total Debt to Total Assets | 22.589 |
| Long-Term Debt to Equity | 37.767 |
| Long-Term Debt to Total Capital | 27.31 |
Hormel Foods Corp. in the News

Hormel recalls 4.9M pounds of chicken possibly 'contaminated with pieces of metal'
Major food recall hits restaurants and hotels as Hormel Foods pulls potentially contaminated chicken products from commercial kitchens due to metal contamination concerns.

Boar's Head recalls 7 million pounds of deli meat after being linked to listeria outbreak
Boar's Head has expanded their product recall to include 7 million pounds of deli meats, saying "The health and well-being of our consumers are paramount."

Memorial Day cookouts cost more this year as price of one BBQ staple jumps a staggering 50 percent in one year
Data collected by Datasembly on grocery prices in the past year point to a more than 10% cost increase in foods that are staples in Memorial Day festivities.
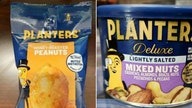
Planters nuts recalled after discovery of potentially fatal contamination
Hormel Foods recalls Planters Honey Roasted Peanuts and Deluxe Lightly Salted Mixed Nuts after discovering they may be contaminated with listeria monocytogenes in southeastern U.S.
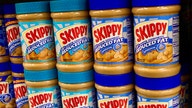
Skippy recalls peanut butter jars that may contain metal fragments
Skippy is recalling thousands of peanut butter jars due to fears of possible metal fragments in the products.

How much more will your Oreos cost? Companies test price increases
American companies are starting to test the extent of their pricing power.