About eli lilly & co. - LLY
LLY At a Glance
| Phone | 1-317-276-2000 | Revenue | 45.04B | |
| Industry | Pharmaceuticals: Major | Net Income | 10.59B | |
| Sector | Health Technology | 2024 Sales Growth | 31.997% | |
| Fiscal Year-end | 12 / 2025 | Employees | N/A | |
| View SEC Filings |
LLY Valuation
| P/E Current | 44.479 |
| P/E Ratio (with extraordinary items) | N/A |
| P/E Ratio (without extraordinary items) | 65.905 |
| Price to Sales Ratio | 15.495 |
| Price to Book Ratio | 51.543 |
| Price to Cash Flow Ratio | 79.15 |
| Enterprise Value to EBITDA | 38.722 |
| Enterprise Value to Sales | 16.168 |
| Total Debt to Enterprise Value | 0.046 |
LLY Efficiency
| Revenue/Employee | 958,355.319 |
| Income Per Employee | 225,319.149 |
| Receivables Turnover | 3.393 |
| Total Asset Turnover | 0.631 |
LLY Liquidity
| Current Ratio | 1.154 |
| Quick Ratio | 0.886 |
| Cash Ratio | 0.121 |
LLY Profitability
| Gross Margin | 81.31 |
| Operating Margin | 37.831 |
| Pretax Margin | 28.152 |
| Net Margin | 23.511 |
| Return on Assets | 14.84 |
| Return on Equity | 84.842 |
| Return on Total Capital | 22.138 |
| Return on Invested Capital | 29.494 |
LLY Capital Structure
| Total Debt to Total Equity | 237.063 |
| Total Debt to Total Capital | 70.332 |
| Total Debt to Total Assets | 42.742 |
| Long-Term Debt to Equity | 201.007 |
| Long-Term Debt to Total Capital | 59.635 |
Eli Lilly & Co. in the News

Major weight loss, pain relief seen with Eli Lilly's next-gen drug in late-stage trial
Eli Lilly's experimental drug, retatrutide, showed strong results in a late-stage trial, helping patients lose nearly 29% of their body weight while reducing osteoarthritis pain.
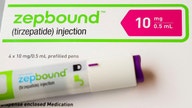
Eli Lilly cuts Zepbound prices in competitive weight loss drug market battle
Eli Lilly will cut prices for its weight loss drug Zepbound, with single-dose vials now available for $299 per month through its LillyDirect platform.

Top 5 most expensive drugs for consumers
Five top-selling drugs, in some cases, are costing Americans thousands in out of pocket expenses weekly and monthly. Here's the list.

Eli Lilly to invest $5B in Virginia plant amid Trump's pharma tariff threats
Pharmaceutical giant Eli Lilly expanded its Virginia facility investment plans to $5 billion from original $2.1 billion amid the Trump administration tariff threats on drug imports.
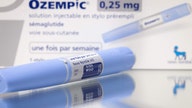
Novo Nordisk to sell weight-loss drug for $499 to eligible customers
Cash-paying type 2 diabetes patients in the United States can now access Novo Nordisk's Ozempic for $499 per month through multiple pharmacy platforms.

AstraZeneca to invest $50B in US economy by 2030
British biopharmaceutical giant AstraZeneca plans to invest $50 billion in the United States by 2030, expanding its presence in the company's largest market.

Novo Nordisk CEO steps down as Wegovy maker faces increased competition
As Novo Nordisk's share price drops, CEO Lars Fruergaard Jorgensen steps down. The company aims to maintain its lead in the competitive weight-loss drug market.

These companies have announced their intention to increase US manufacturing amid Trump's first 100 days
Numerous companies have unveiled investments in U.S. manufacturing in recent weeks, including TSMC, Eli Lilly, Hyundai Motor Group and others.

Weight-loss drugs entering 'new era' with breakthrough daily pill
Made in the USA, a new daily oral weight-loss pill from Eli Lilly won't require cold storage and is expected to hit markets in 2026. It reportedly works as well as Ozempic.

Pfizer will end development of daily weight-loss pill after liver injury
Pfizer is facing another setback with its weight-loss pill, danuglipron. The pharmaceutical giant stopped development of the drug after liver issues affected one patient.