lvmh moët hennessy louis vuitton se - LVMUY

LVMUY

Close Chg Chg %
130.60 -1.28 -0.98%

Open Market

129.32

-1.28 (0.98%)

Volume: 221.76K

Last Updated:

Jan 30, 2026, 3:20 PM EDT

Company Overview: lvmh moët hennessy louis vuitton se - LVMUY

LVMUY Key Data

Open

$130.42

Day Range

129.00 - 131.08

52 Week Range

101.80 - 152.95

Market Cap

$324.14B

Shares Outstanding

2.48B

Public Float

2.48B

Beta

1.20

Rev. Per Employee

N/A

P/E Ratio

26.47

EPS

N/A

Yield

160.46%

Dividend

$0.89

EX-DIVIDEND DATE

Dec 1, 2025

SHORT INTEREST

N/A

AVERAGE VOLUME

265.06K


LVMUY Performance

1 Week
 
-6.56%
 
1 Month
 
-13.40%
 
3 Months
 
-7.64%
 
1 Year
 
-10.34%
 
5 Years
 
7.01%
 

LVMUY Analyst Ratings

  • Sell
  • Under
  • Hold
  • Over
  • Buy
Number of Ratings 27
Full Ratings ➔

About lvmh moët hennessy louis vuitton se - LVMUY

LVMH Moët Hennessy Louis Vuitton SE engages in the manufacture of luxury goods. It operates through the following segments: Wines and Spirits, Fashion and Leather Goods, Perfumes and Cosmetics, Watches and Jewelry, Selective Retailing, and Other and Holding Companies. The Wines and Spirits segment is involved in the production and sale of champagne wines and sparkling wines, as well as distribution of vodka and white liquor. The Fashion and Leather Goods segment offers luggage items, bags, accessories, shoes, and clothes. The Perfumes and Cosmetics segment distributes make-up, perfume, and skin care products. The Watches and Jewelry segment manufactures luxury watches and accessories for men and women. The Selective Retailing segment is organized to promote an environment that is appropriate to the image and status of the luxury brands. The Other and Holding Companies segment pertains to the media division, which publishes newspapers and magazines, manages business and financial websites, and holds radio stations. The company was founded by Bernard Arnault on January 13, 1923 and is headquartered in Paris, France.

LVMUY At a Glance

LVMH Moët Hennessy Louis Vuitton SE
22 avenue Montaigne
Paris, Ile-de-France 75008
Phone 33-1-44-13-22-22 Revenue 91.20B
Industry Apparel/Footwear Net Income 12.28B
Sector Consumer Non-Durables Employees 211,000
Fiscal Year-end 12 / 2026
View SEC Filings

LVMUY Valuation

P/E Current 26.229
P/E Ratio (with extraordinary items) N/A
P/E Ratio (without extraordinary items) 30.566
Price to Sales Ratio 4.117
Price to Book Ratio 4.724
Price to Cash Flow Ratio 17.61
Enterprise Value to EBITDA 14.73
Enterprise Value to Sales 4.43
Total Debt to Enterprise Value 0.105

LVMUY Efficiency

Revenue/Employee 432,213.263
Income Per Employee 58,183.275
Receivables Turnover 10.373
Total Asset Turnover 0.568

LVMUY Liquidity

Current Ratio 1.584
Quick Ratio 0.828
Cash Ratio 0.444

LVMUY Profitability

Gross Margin 66.242
Operating Margin 21.879
Pretax Margin 20.571
Net Margin 13.462
Return on Assets 7.642
Return on Equity 16.461
Return on Total Capital 10.075
Return on Invested Capital 11.841

LVMUY Capital Structure

Total Debt to Total Equity 53.766
Total Debt to Total Capital 34.966
Total Debt to Total Assets 25.541
Long-Term Debt to Equity 38.241
Long-Term Debt to Total Capital 24.87
  • Income Statement
  • Balance Sheet
  • Cash Flow Statement

Annual Financials for Lvmh Moët Hennessy Louis Vuitton Se - LVMUY

Collapse All in section
All values USD millions. 2022 2023 2024 2025 5-year trend
Sales/Revenue
83.22B 93.14B 91.60B 91.20B
Sales Growth
+9.64% +11.92% -1.65% -0.44%
Cost of Goods Sold (COGS) incl D&A
26.26B 29.06B 30.20B 30.79B
COGS excluding D&A
- - - -
-
Depreciation & Amortization Expense
5.90B 6.44B 7.08B 7.47B
Depreciation
5.26B 5.67B 6.20B 6.63B
Amortization of Intangibles
634.79M 778.40M 880.50M 846.43M
COGS Growth
+9.11% +10.64% +3.93% +1.95%
Gross Income
56.96B 64.09B 61.40B 60.41B
Gross Income Growth
+9.89% +12.51% -4.19% -1.62%
Gross Profit Margin
+68.44% +68.80% +67.03% +66.24%
2022 2023 2024 2025 5-year trend
SG&A Expense
34.87B 39.44B 40.26B 40.46B
Research & Development
- - - 180.77M
-
Other SG&A
34.69B 39.44B 40.26B 40.46B
SGA Growth
+10.40% +13.11% +2.08% +0.48%
Other Operating Expense
- - - -
-
Unusual Expense
446.66M 282.17M 324.51M 273.12M
EBIT after Unusual Expense
21.64B 24.36B 20.81B 19.68B
Non Operating Income/Expense
(141.88M) 61.62M 32.45M 379.20M
Non-Operating Interest Income
67.26M 164.33M 195.79M 205.40M
Equity in Earnings of Affiliates
- - - -
-
Interest Expense
401.47M 1.05B 1.28B 1.30B
Interest Expense Growth
+40.36% +162.02% +21.96% +1.26%
Gross Interest Expense
401.47M 1.05B 1.28B 1.30B
Interest Capitalized
- - - -
-
Pretax Income
21.10B 23.37B 19.56B 18.76B
Pretax Income Growth
+3.81% +10.77% -16.29% -4.11%
Pretax Margin
+25.35% +25.09% +21.36% +20.57%
Income Tax
5.64B 6.13B 5.58B 6.18B
Income Tax - Current - Domestic
- 6.20B 6.54B 5.86B
Income Tax - Current - Foreign
- - - -
-
Income Tax - Deferred - Domestic
- (561.22M) (408.66M) (280.16M)
Income Tax - Deferred - Foreign
- - - -
-
Income Tax Credits
- - - -
-
Equity in Earnings of Affiliates
- - - -
-
Other After Tax Income (Expense)
- - - -
-
Consolidated Net Income
15.50B 17.25B 14.02B 12.66B
Minority Interest Expense
701.00M 841.11M 441.33M 388.23M
Net Income
14.80B 16.40B 13.58B 12.28B
Net Income Growth
+4.05% +10.83% -17.25% -9.57%
Net Margin Growth
+17.79% +17.61% +14.82% +13.46%
Extraordinaries & Discontinued Operations
- - - -
-
Discontinued Operations
- - - -
-
Net Income After Extraordinaries
14.80B 16.40B 13.58B 12.28B
Preferred Dividends
- - - -
-
Net Income Available to Common
14.80B 16.40B 13.58B 12.28B
EPS (Basic)
5.8958 6.5612 5.4365 4.9339
EPS (Basic) Growth
+4.36% +11.29% -17.14% -9.24%
Basic Shares Outstanding
2.51B 2.50B 2.50B 2.49B
EPS (Diluted)
5.8915 6.5579 5.4336 4.9319
EPS (Diluted) Growth
+4.34% +11.31% -17.14% -9.23%
Diluted Shares Outstanding
2.51B 2.50B 2.50B 2.49B
EBITDA
27.99B 31.09B 28.22B 27.43B
EBITDA Growth
+6.72% +11.08% -9.21% -2.82%
EBITDA Margin
+33.63% +33.38% +30.81% +30.07%

Snapshot

Average Recommendation OVERWEIGHT Average Target Price 157.05
Number of Ratings 27 Current Quarters Estimate N/A
FY Report Date N/A Current Year's Estimate 5.486
Last Quarter’s Earnings 2.489 Median PE on CY Estimate N/A
Year Ago Earnings 5.264 Next Fiscal Year Estimate 6.316
Median PE on Next FY Estimate N/A

Earnings Per Share

This Quarter Next Quarter This Fiscal Next Fiscal
# of Estimates N/A N/A 23 23
Mean Estimate N/A N/A 5.49 6.32
High Estimates N/A N/A 5.87 6.77
Low Estimate N/A N/A 5.18 5.74
Coefficient of Variance N/A N/A 3.11 4.10

Analysts Recommendations

Current 1 Month Ago 3 Months Ago
BUY 10 14 12
OVERWEIGHT 4 3 3
HOLD 13 11 12
UNDERWEIGHT 0 1 1
SELL 0 0 0
MEAN Overweight Overweight Overweight

Lvmh MoëT Hennessy Louis Vuitton Se in the News

LVMH loves Birkenstock as IPO kicks off

LVMH has provided backing for Birkenstock through a private equity firm. The popular sandal maker began trading on the New York Stock Exchange debut on Wednesday opening below its offering price.
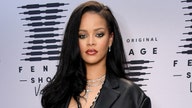