About mattel inc. - MAT
MAT At a Glance
| Phone | 1-310-252-2000 | Revenue | 5.38B | |
| Industry | Recreational Products | Net Income | 541.82M | |
| Sector | Consumer Durables | Employees | 34,000 | |
| Fiscal Year-end | 12 / 2025 | |||
| View SEC Filings |
MAT Valuation
| P/E Current | 15.815 |
| P/E Ratio (with extraordinary items) | N/A |
| P/E Ratio (without extraordinary items) | 11.235 |
| Price to Sales Ratio | 1.132 |
| Price to Book Ratio | 2.584 |
| Price to Cash Flow Ratio | 7.60 |
| Enterprise Value to EBITDA | 8.301 |
| Enterprise Value to Sales | 1.373 |
| Total Debt to Enterprise Value | 0.364 |
MAT Efficiency
| Revenue/Employee | 158,221.941 |
| Income Per Employee | 15,935.794 |
| Receivables Turnover | 5.363 |
| Total Asset Turnover | 0.829 |
MAT Liquidity
| Current Ratio | 2.377 |
| Quick Ratio | 1.995 |
| Cash Ratio | 1.055 |
MAT Profitability
| Gross Margin | 49.919 |
| Operating Margin | 13.418 |
| Pretax Margin | 11.572 |
| Net Margin | 10.072 |
| Return on Assets | 8.349 |
| Return on Equity | 24.554 |
| Return on Total Capital | 10.943 |
| Return on Invested Capital | 11.27 |
MAT Capital Structure
| Total Debt to Total Equity | 118.69 |
| Total Debt to Total Capital | 54.273 |
| Total Debt to Total Assets | 41.064 |
| Long-Term Debt to Equity | 115.388 |
| Long-Term Debt to Total Capital | 52.763 |
Mattel Inc. in the News

Barbie releases doll with type 1 diabetes as diagnoses rise among US children
The new type 1 diabetes Barbie doll includes realistic medical features like a CGM monitor and insulin pump as cases rise among young people in the United States.

Barbie maker Mattel raises prices amid Trump tariff fight
Barbie-maker Mattel announced it is raising prices on some of its toys as it navigates a "volatile macro-economic environment and evolving U.S. tariff landscape."

Mattel considers raising prices on toys to mitigate tariff impact
Mattel is looking at potentially upping toy prices as part of its efforts to mitigate President Donald Trump’s tariffs on imports from China, Mexico and Canada.

Mattel sued over 'Wicked' dolls packaging that included adult website link
Mattel is being sued after dolls which the toy company created for the new movie "Wicked" were released in packaging that included the link for a pornographic website.

Life-sized Polly Pocket Airbnb in Massachusetts to open for booking
Airbnb is offering a nostalgic experience announcing a Polly Pocket-themed stay in Littleton, Massachusetts, which looks like the actual toy from the 1990s.

Mattel releases 'Blind Barbie' doll, plus 'Black Barbie doll with Down syndrome'
Two new Barbie dolls with disabilities were announced on July 23, the first-ever blind Barbie doll and the second Barbie doll with Down syndrome, Mattel said in a press release
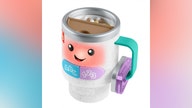
Retailers struggling to keep popular Stanley cup-like toy by Fisher-Price in stock
A new Fisher-Price toy resembling a coffee mug and aimed for children 6 months to 3 years old, is difficult to find on shelves due to the current Stanley cup craze.

Mattel wants to bring American Girl to the silver screen
Mattel Inc. is looking to capitalize on another popular doll brand as it works to bring American Girl to the silver screen. It announced the upcoming project on Wednesday.
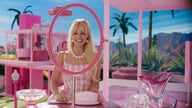
Success of 'Barbie' movie could be financial boon for Mattel
The 'Barbie' movie with Margo Robbie has experienced major success in the weeks since its debut - and it could prove a financial boon for Mattel, the company that owns the brand.
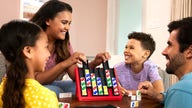
Mattel looking to hire 'chief UNO player' to get paid for playing games
Mattel is in search of a chief UNO player to introduce fans to the company's new UNO Quatro card game. Here's how to learn more about the gig and submit an application.