About novo nordisk a/s - NVO
NVO At a Glance
| Phone | 45-44-44-88-88 | Revenue | 46.74B | |
| Industry | Pharmaceuticals: Major | Net Income | 15.49B | |
| Sector | Health Technology | 2025 Sales Growth | 10.972% | |
| Fiscal Year-end | 12 / 2026 | Employees | 68,794 | |
| View SEC Filings |
NVO Valuation
| P/E Current | 12.432 |
| P/E Ratio (with extraordinary items) | N/A |
| P/E Ratio (without extraordinary items) | 14.594 |
| Price to Sales Ratio | 4.842 |
| Price to Book Ratio | 7.41 |
| Price to Cash Flow Ratio | 12.56 |
| Enterprise Value to EBITDA | 10.72 |
| Enterprise Value to Sales | 5.192 |
| Total Debt to Enterprise Value | 0.085 |
NVO Efficiency
| Revenue/Employee | 679,358.447 |
| Income Per Employee | 225,161.789 |
| Receivables Turnover | 3.926 |
| Total Asset Turnover | 0.623 |
NVO Liquidity
| Current Ratio | 0.80 |
| Quick Ratio | 0.57 |
| Cash Ratio | 0.125 |
NVO Profitability
| Gross Margin | 80.341 |
| Operating Margin | 41.402 |
| Pretax Margin | 42.24 |
| Net Margin | 33.143 |
| Return on Assets | 20.647 |
| Return on Equity | 61.423 |
| Return on Total Capital | 30.31 |
| Return on Invested Capital | 37.969 |
NVO Capital Structure
| Total Debt to Total Equity | 67.488 |
| Total Debt to Total Capital | 40.294 |
| Total Debt to Total Assets | 24.122 |
| Long-Term Debt to Equity | 61.295 |
| Long-Term Debt to Total Capital | 36.597 |
Novo Nordisk A/S in the News
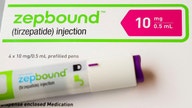
Eli Lilly cuts Zepbound prices in competitive weight loss drug market battle
Eli Lilly will cut prices for its weight loss drug Zepbound, with single-dose vials now available for $299 per month through its LillyDirect platform.

Costco members will soon have access to weight-loss shots at a major discount
Costco is partnering with the healthcare company Novo Nordisk to give members access to GLP-1 medications at just $499 for a four-week supply.
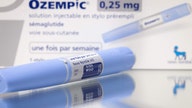
Novo Nordisk to sell weight-loss drug for $499 to eligible customers
Cash-paying type 2 diabetes patients in the United States can now access Novo Nordisk's Ozempic for $499 per month through multiple pharmacy platforms.

Novo Nordisk CEO steps down as Wegovy maker faces increased competition
As Novo Nordisk's share price drops, CEO Lars Fruergaard Jorgensen steps down. The company aims to maintain its lead in the competitive weight-loss drug market.

Hims & Hers partners with Novo Nordisk to sell Wegovy
Hims & Hers on Tuesday announced a collaboration with drugmaker Novo Nordisk to bundle Wegovy and a Hims & Hers membership on its telehealth platform.

Pfizer will end development of daily weight-loss pill after liver injury
Pfizer is facing another setback with its weight-loss pill, danuglipron. The pharmaceutical giant stopped development of the drug after liver issues affected one patient.

Novo Nordisk shares fall on weight-loss drug trial
Novo Nordisk released the results from its late-stage trial of CagriSema on Monday. It showed that patients on the highest dose of the drug lost 15.7% of their weight.
Running low on Ozempic or another weight loss drug? A new tracker can help
Telehealth company Ro has rolled out a new tool to track the supply of weight loss drugs like Ozempic and Wegovy across the U.S., as patients struggle with shortages.

Nestlé launches food line targeting Ozempic, other weight-loss drug users
Nestlé's new food line, Vital Pursuit, is specifically targeted toward patients using weight-loss medications, which continues to surge in popularity.

25K Americans starting Wegovy weekly as supply increases and prices drop, drugmaker says
Novo Nordisk has been slowly increasing production capacity of its highly coveted weight loss drugs. As a result, thousands of people have began treatment per week.