About papa john's international inc. - PZZA
PZZA At a Glance
| Phone | 1-502-261-7272 | Revenue | 2.05B | |
| Industry | Restaurants | Net Income | 30.53M | |
| Sector | Consumer Services | Employees | 9,400 | |
| Fiscal Year-end | 12 / 2026 | |||
| View SEC Filings |
PZZA Valuation
| P/E Current | 38.986 |
| P/E Ratio (with extraordinary items) | N/A |
| P/E Ratio (without extraordinary items) | 43.788 |
| Price to Sales Ratio | 0.63 |
| Price to Book Ratio | N/A |
| Price to Cash Flow Ratio | 10.28 |
| Enterprise Value to EBITDA | 11.866 |
| Enterprise Value to Sales | 1.074 |
| Total Debt to Enterprise Value | 0.424 |
PZZA Efficiency
| Revenue/Employee | 218,490.213 |
| Income Per Employee | 3,247.979 |
| Receivables Turnover | 18.233 |
| Total Asset Turnover | 2.166 |
PZZA Liquidity
| Current Ratio | 0.816 |
| Quick Ratio | 0.698 |
| Cash Ratio | 0.127 |
PZZA Profitability
| Gross Margin | 16.235 |
| Operating Margin | 4.561 |
| Pretax Margin | 2.356 |
| Net Margin | 1.487 |
| Return on Assets | 3.219 |
| Return on Equity | N/A |
| Return on Total Capital | 6.21 |
| Return on Invested Capital | 6.351 |
PZZA Capital Structure
| Total Debt to Total Equity | N/A |
| Total Debt to Total Capital | 190.467 |
| Total Debt to Total Assets | 101.018 |
| Long-Term Debt to Equity | N/A |
| Long-Term Debt to Total Capital | 182.591 |
Papa John'S International Inc. in the News

Papa John's reportedly weighs $1.5B buyout offer from Qatari royal family-backed firm
Papa John's stock surges 15% as Qatari-backed fund reportedly offers $1.5B buyout at $47 a share, a 44% premium; the pizza chain is reviewing the proposal.
Papa John's to close hundreds of restaurants
Papa John's plans to close 300 underperforming restaurants in North America by 2027, with 200 closures expected this year, CFO Ravi Thanawala said.

Domino's Pizza debuts stuffed crust in effort to boost sales
Domino's on Monday announced that customers can now order cheese-filled crust at all U.S. locations, joining the ranks of pizza chains that already offer it.
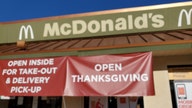
Need fast-food? These restaurants are open on Thanksgiving Day 2023
Fast-food restaurants like McDonald's and Starbucks will be open on Thanksgiving Day 2023, as well as chain restaurants including Cracker Barrel, Golden Corral and many more.

Pizza Hut launches new melty sandwich as pizza pie alternative for solo customers
Pizza Hut has launched a new line of Pizza Hut Melts for solo customers who want a pizza-like meal without committing to an entire pizza pie.
National Pepperoni Pizza Day 2022: Where to snag a deal on a yummy slice
On National Pepperoni Pizza Day this year, Sept. 20, 2022, celebrate by grabbing one of these deals. Retailers across the country are giving customers a reason to indulge.
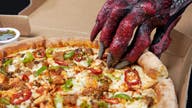
Papa John's launching Dragon Flame Pizza inspired by 'Game of Thrones' prequel
Papa John’s is launching a Dragon Flame Pizza that's pegged to the Aug. 21 release of HBO's "House of the Dragon" – which is a spinoff prequel series to "Game of Thrones."

Some Western companies decline to join corporate exodus from Russia over Ukraine invasion
The corporate exodus from Russia continued Tuesday as McDonald's, Coca-Cola, Starbucks, and Pepsi announced that they are temporarily suspending business in Russia over Putin's invasion of Ukraine.
US fast food brands vulnerable to shutdowns in Russia amid Ukraine conflict
Major American fast food giants could take a hit if Russia decides to shut down locations in its country in response to U.S. sanctions

Domino's stock hits record, $1B buyback in place
Domino's Pizza CEO gave a nod to the company's franchisees for helping drive solid quarterly sales.