freightcar america inc - RAIL

RAIL

Close Chg Chg %
10.51 -0.86 -8.18%

Pre-Market

9.65

-0.86 (8.18%)

Volume: 598.07K

Last Updated:

Nov 21, 2024, 4:00 PM EDT

Company Overview: freightcar america inc - RAIL

RAIL Key Data

Open

$10.43

Day Range

9.54 - 10.43

52 Week Range

2.26 - 16.10

Market Cap

$198.58M

Shares Outstanding

18.89M

Public Float

14.32M

Beta

2.01

Rev. Per Employee

N/A

P/E Ratio

N/A

EPS

-$4.23

Yield

0.00%

Dividend

$0.09

EX-DIVIDEND DATE

Aug 15, 2017

SHORT INTEREST

N/A

AVERAGE VOLUME

620.52K


RAIL Performance

1 Week
 
-2.53%
 
1 Month
 
-33.77%
 
3 Months
 
56.66%
 
1 Year
 
301.25%
 
5 Years
 
359.52%
 

RAIL Analyst Ratings

  • Sell
  • Under
  • Hold
  • Over
  • Buy
Number of Ratings 1
Full Ratings ➔

About freightcar america inc - RAIL

FreightCar America, Inc. engages in the manufacture of railcars and railcar components. It operates through the Manufacturing and Corporate and Other segments. The Manufacturing segment includes new railcar manufacturing, used railcar sales, railcar leasing and major railcar rebuilds. The Corporate and Other segment focuses on the sales of parts. The company was founded in 1901 and is headquartered in Chicago, IL.

RAIL At a Glance

FreightCar America, Inc.
125 South Wacker Drive
Chicago, Illinois 60606
Phone 1-312-458-2235 Revenue 358.09M
Industry Trucks/Construction/Farm Machinery Net Income -23,589,000.00
Sector Producer Manufacturing Employees 2,023
Fiscal Year-end 12 / 2024
View SEC Filings

RAIL Valuation

P/E Current N/A
P/E Ratio (with extraordinary items) N/A
P/E Ratio (without extraordinary items) N/A
Price to Sales Ratio 0.214
Price to Book Ratio N/A
Price to Cash Flow Ratio 16.06
Enterprise Value to EBITDA 10.338
Enterprise Value to Sales 0.545
Total Debt to Enterprise Value 0.388

RAIL Efficiency

Revenue/Employee 177,010.875
Income Per Employee -11,660.405
Receivables Turnover 38.364
Total Asset Turnover 1.56

RAIL Liquidity

Current Ratio 1.313
Quick Ratio 0.403
Cash Ratio 0.295

RAIL Profitability

Gross Margin 11.663
Operating Margin 3.986
Pretax Margin -6.168
Net Margin -6.587
Return on Assets -10.274
Return on Equity N/A
Return on Total Capital -79.979
Return on Invested Capital -83.997

RAIL Capital Structure

Total Debt to Total Equity N/A
Total Debt to Total Capital 256.662
Total Debt to Total Assets 29.176
Long-Term Debt to Equity N/A
Long-Term Debt to Total Capital 150.665
  • Income Statement
  • Balance Sheet
  • Cash Flow Statement

Annual Financials for Freightcar America Inc - RAIL

Collapse All in section
All values USD millions. 2020 2021 2022 2023 5-year trend
Sales/Revenue
108.45M 203.05M 364.75M 358.09M
Sales Growth
-52.84% +87.23% +79.64% -1.83%
Cost of Goods Sold (COGS) incl D&A
121.95M 191.59M 338.93M 316.33M
COGS excluding D&A
- - - -
-
Depreciation & Amortization Expense
16.27M 5.79M 6.46M 4.61M
Depreciation
16.27M 5.79M 6.46M 4.61M
Amortization of Intangibles
- - - -
-
COGS Growth
-50.07% +57.11% +76.90% -6.67%
Gross Income
(13.50M) 11.46M 25.82M 41.76M
Gross Income Growth
+5.58% +184.86% +125.37% +61.73%
Gross Profit Margin
-12.45% +5.64% +7.08% +11.66%
2020 2021 2022 2023 5-year trend
SG&A Expense
29.82M 27.53M 28.23M 27.49M
Research & Development
- - - -
-
Other SG&A
29.82M 27.53M 28.23M 27.49M
SGA Growth
-22.16% -7.66% +2.52% -2.61%
Other Operating Expense
- - - -
-
Unusual Expense
40.93M 11.46M 3.03M 21.51M
EBIT after Unusual Expense
(84.25M) (27.53M) (5.43M) (7.24M)
Non Operating Income/Expense
576.00K 817.00K (5.68M) 182.00K
Non-Operating Interest Income
- - - -
-
Equity in Earnings of Affiliates
- - - -
-
Interest Expense
2.23M 13.32M 25.42M 15.03M
Interest Expense Growth
+265.35% +498.52% +90.91% -40.88%
Gross Interest Expense
2.23M 13.32M 25.42M 15.03M
Interest Capitalized
- - - -
-
Pretax Income
(85.90M) (40.03M) (36.53M) (22.09M)
Pretax Income Growth
-14.00% +53.39% +8.74% +39.54%
Pretax Margin
-79.21% -19.72% -10.02% -6.17%
Income Tax
199.00K 1.41M 2.31M 1.50M
Income Tax - Current - Domestic
(75.00K) 16.00K 40.00K 39.00K
Income Tax - Current - Foreign
137.00K 1.53M 2.29M 2.56M
Income Tax - Deferred - Domestic
- 1.00K 1.00K 1.00K
Income Tax - Deferred - Foreign
136.00K (136.00K) (14.00K) (1.09M)
Income Tax Credits
- - - -
-
Equity in Earnings of Affiliates
- - - -
-
Other After Tax Income (Expense)
- - - -
-
Consolidated Net Income
(86.10M) (41.45M) (38.85M) (23.59M)
Minority Interest Expense
- - - (1.66M)
-
Net Income
(84.44M) (41.45M) (38.85M) (23.59M)
Net Income Growth
-12.32% +50.92% +6.27% +39.28%
Net Margin Growth
-77.87% -20.41% -10.65% -6.59%
Extraordinaries & Discontinued Operations
- - - -
-
Discontinued Operations
- - - -
-
Net Income After Extraordinaries
(84.44M) (41.45M) (38.85M) (23.59M)
Preferred Dividends
- - - 9.98M
-
Net Income Available to Common
(84.44M) (41.45M) (38.85M) (33.57M)
EPS (Basic)
-6.2865 -1.9959 -1.564 -1.1835
EPS (Basic) Growth
-3.28% +68.25% +21.64% +24.33%
Basic Shares Outstanding
13.43M 20.77M 24.84M 28.37M
EPS (Diluted)
-6.2865 -1.9959 -1.564 -1.1835
EPS (Diluted) Growth
-3.28% +68.25% +21.64% +24.33%
Diluted Shares Outstanding
13.43M 20.77M 24.84M 28.37M
EBITDA
(27.05M) (10.29M) 4.06M 18.88M
EBITDA Growth
+8.85% +61.97% +139.43% +365.48%
EBITDA Margin
-24.94% -5.07% +1.11% +5.27%

Snapshot

Average Recommendation BUY Average Target Price 13.375
Number of Ratings 1 Current Quarters Estimate 0.045
FY Report Date 12 / 2024 Current Year's Estimate 0.235
Last Quarter’s Earnings 0.08 Median PE on CY Estimate N/A
Year Ago Earnings -0.39 Next Fiscal Year Estimate 0.735
Median PE on Next FY Estimate N/A

Earnings Per Share

This Quarter Next Quarter This Fiscal Next Fiscal
# of Estimates 2 2 2 2
Mean Estimate 0.05 0.21 0.24 0.74
High Estimates 0.07 0.21 0.30 0.77
Low Estimate 0.02 0.20 0.17 0.70
Coefficient of Variance 78.57 3.45 39.12 6.73

Analysts Recommendations

Current 1 Month Ago 3 Months Ago
BUY 1 1 1
OVERWEIGHT 0 0 0
HOLD 0 0 0
UNDERWEIGHT 0 0 0
SELL 0 0 0
MEAN Buy Buy Buy

Insider Actions for Freightcar America Inc - RAIL

Date Name Shares Transaction Value
Sep 27, 2024 Elizabeth Keller Arnold Director 115,999 Bona fide gift 0.00
May 17, 2024 William D. Gehl Director 170,108 Grant, award or other acq pursuant to Rule 16b-3(d) 0.00
May 17, 2024 Malcolm F. Moore Director 147,066 Grant, award or other acq pursuant to Rule 16b-3(d) 0.00
May 17, 2024 Travis D. Kelly Director 20,408 Grant, award or other acq pursuant to Rule 16b-3(d) 0.00
May 17, 2024 James R. Meyer Director 814,878 Grant, award or other acq pursuant to Rule 16b-3(d) 0.00
May 17, 2024 Rodger L. Boehm Director 62,275 Grant, award or other acq pursuant to Rule 16b-3(d) 0.00
May 17, 2024 Jesus Salvador Gil Benavides Director 366,202 Grant, award or other acq pursuant to Rule 16b-3(d) 0.00
May 17, 2024 Jose de Nigris Felan Director 69,147 Grant, award or other acq pursuant to Rule 16b-3(d) 0.00
May 3, 2024 Nicholas J. Randall President and CEO; Director 151,099 Grant, award or other acq pursuant to Rule 16b-3(d) 0.00
May 3, 2024 Nicholas J. Randall President and CEO; Director 67,619 Grant, award or other acq pursuant to Rule 16b-3(d) 0.00
Apr 12, 2024 Jesus Salvador Gil Benavides Director 345,794 Exercise or conversion of derivative security exempted pursuant to Rule 16b-3 Non-derivative transaction at $3.22 per share 1,113,456.68
Apr 12, 2024 Jesus Salvador Gil Benavides Director N/A Exercise or conversion of derivative security exempted pursuant to Rule 16b-3 0.00

Freightcar America Inc in the News

Markets

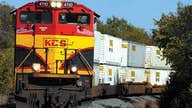
Kansas City Southern expected to terminate Canadian Pacific deal

Kansas City Southern is expected to ditch its merger agreement with Canadian Pacific Railway Ltd. in favor of a competing proposal from Canadian National Railway Co. according to people familiar with the matter, a dramatic turn with big implications for the shape of the U.S. rail industry.