About boston beer co. inc. - SAM
SAM At a Glance
| Phone | 1-617-368-5000 | Revenue | 2.01B | |
| Industry | Beverages: Alcoholic | Net Income | 59.70M | |
| Sector | Consumer Non-Durables | 2024 Sales Growth | 0.214% | |
| Fiscal Year-end | 12 / 2025 | Employees | 2,537 | |
| View SEC Filings |
SAM Valuation
| P/E Current | 28.134 |
| P/E Ratio (with extraordinary items) | N/A |
| P/E Ratio (without extraordinary items) | 58.806 |
| Price to Sales Ratio | 1.744 |
| Price to Book Ratio | 3.687 |
| Price to Cash Flow Ratio | 14.10 |
| Enterprise Value to EBITDA | 13.578 |
| Enterprise Value to Sales | 1.658 |
| Total Debt to Enterprise Value | 0.012 |
SAM Efficiency
| Revenue/Employee | 793,427.67 |
| Income Per Employee | 23,529.76 |
| Receivables Turnover | 29.557 |
| Total Asset Turnover | 1.468 |
SAM Liquidity
| Current Ratio | 1.802 |
| Quick Ratio | 1.296 |
| Cash Ratio | 0.914 |
SAM Profitability
| Gross Margin | 44.40 |
| Operating Margin | 7.541 |
| Pretax Margin | 4.352 |
| Net Margin | 2.966 |
| Return on Assets | 4.355 |
| Return on Equity | 5.987 |
| Return on Total Capital | 6.251 |
| Return on Invested Capital | 5.788 |
SAM Capital Structure
| Total Debt to Total Equity | 4.233 |
| Total Debt to Total Capital | 4.061 |
| Total Debt to Total Assets | 3.025 |
| Long-Term Debt to Equity | 3.399 |
| Long-Term Debt to Total Capital | 3.261 |
Boston Beer Co. Inc. in the News

Alcohol maker stocks see declines in wake of Surgeon General cancer advisory
Popular alcohol producers had a bumpy morning as investors reacted to an advisory from the U.S. Surgeon General about alcohol and cancer.

Jimmy Carter remembered as 'hero' that sparked craft beer industry
Boston Beer Co. founder Jim Koch and America's homebrewers credit former President Jimmy Carter with sparking the nation's craft beer industry, hailing him a "hero."
Bud Light parent Anheuser-Busch sees $27 billion gone, shares near bear market
Bud Light's marketing push rolled out two months ago has been a headache and a costly move for parent company Anheuser-Busch and its shareholders.
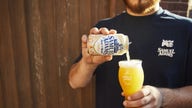
Samuel Adams masters non-alcoholic beer with Just the Haze, remasters Boston Lager
Samuel Adams introduced its fist non-alcoholic beer in 2022, winning a gold medal at the Great American Beer Festival, and introduced Remastered Boston Lager in 2023.
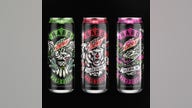
Mountain Dew goes hard as PepsiCo, Boston Beer partner on a boozy version
Boston Beer, the company behind the Samuel Adams beer and Angry Orchard hard cider, will make the alcoholic Mountain Dew rendition, while PepsiCo has set up a new entity to sell the product, the companies said. They expect it to be on shelves in early 2022.
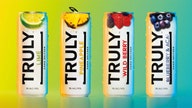
Boston Beer stock obliterated as hard seltzer hit
Boston Beer's management team underestimated the slowdown in the once red-hot hard seltzer category.