About shake shack - SHAK
SHAK At a Glance
| Phone | 1-646-747-7200 | Revenue | 1.25B | |
| Industry | Restaurants | Net Income | 10.21M | |
| Sector | Consumer Services | 2024 Sales Growth | 15.179% | |
| Fiscal Year-end | 12 / 2025 | Employees | 12,826 | |
| View SEC Filings |
SHAK Valuation
| P/E Current | 91.424 |
| P/E Ratio (with extraordinary items) | N/A |
| P/E Ratio (without extraordinary items) | 571.806 |
| Price to Sales Ratio | 4.659 |
| Price to Book Ratio | 11.255 |
| Price to Cash Flow Ratio | 34.10 |
| Enterprise Value to EBITDA | 40.812 |
| Enterprise Value to Sales | 5.068 |
| Total Debt to Enterprise Value | 0.128 |
SHAK Efficiency
| Revenue/Employee | 97,661.625 |
| Income Per Employee | 795.805 |
| Receivables Turnover | 63.626 |
| Total Asset Turnover | 0.756 |
SHAK Liquidity
| Current Ratio | 1.966 |
| Quick Ratio | 1.934 |
| Cash Ratio | 1.712 |
SHAK Profitability
| Gross Margin | 15.796 |
| Operating Margin | 4.068 |
| Pretax Margin | 1.137 |
| Net Margin | 0.815 |
| Return on Assets | 0.616 |
| Return on Equity | 2.235 |
| Return on Total Capital | 0.798 |
| Return on Invested Capital | 0.857 |
SHAK Capital Structure
| Total Debt to Total Equity | 172.254 |
| Total Debt to Total Capital | 63.27 |
| Total Debt to Total Assets | 47.575 |
| Long-Term Debt to Equity | 159.525 |
| Long-Term Debt to Total Capital | 58.594 |
Shake Shack in the News

Steak ’n Shake touts $2.50 ‘Patriot Milkshake’ to honor America's semiquincentennial
Steak 'n Shake launches $2.50 'Patriot Milkshake' promotion for January with red, white and blue sprinkles celebrating America's 250th anniversary.

Shake Shack plans monster expansion
The company raised its target for company-operated restaurants in America to “at least" 1,500 in the long-term, Shake Shack revealed Monday.
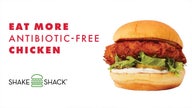
Shake Shack shades Chick-fil-A with free chicken sandwich on Sundays: 'Eat More Antibiotic-Free Chicken'
Shack Shack appeared to show shade at Chick-fil-A, offering a free chicken sandwich is a Sunday-only promotion.
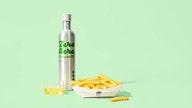
Shake Shack is testing environmentally friendly cooking oil
Shack Shack and Zero Acre Farms are partnering on a cooking oil pilot program at restaurants in New York City. The oil brand claims to be good for the environment and people's health.
Shake Shack introduces fine dining experience to promote new white truffle menu
Shake Shack is offering "The Truffle Table" experience to customers interested in sampling their white truffle menu, which also includes unlimited wine and a bottle of truffle oil.
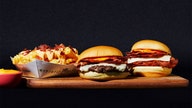
Shake Shack offers spicy menu in collaboration with 'Hot Ones' YouTube show
Shake Shack has partnered with the YouTube series “Hot Ones” to create a spicy menu including a burger, a chicken sandwich and cheese fries.
Some Starbucks, Chipotle sites cut hours, limit seating over omicron
Chains such as Starbucks Corp. and Chipotle Mexican Grill Inc. said they are temporarily limiting operations at individual stores or regions as they face labor shortages and a rise in Covid-19 cases.
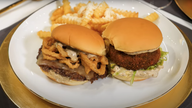
Shake Shack adds black truffle burger, fries to menus — here’s how to get an early taste
Shake Shack is adding the Black Truffle Burger to its menus officially on Thursday.