About samsung electronics co. ltd. - SSNLF
SSNLF At a Glance
| Phone | 82-2-2255-0114 | Revenue | 234.73B | |
| Industry | Telecommunications Equipment | Net Income | 31.81B | |
| Sector | Electronic Technology | 2025 Sales Growth | 6.391% | |
| Fiscal Year-end | 12 / 2026 | Employees | N/A | |
| View SEC Filings |
SSNLF Valuation
| P/E Current | N/A |
| P/E Ratio (with extraordinary items) | N/A |
| P/E Ratio (without extraordinary items) | 17.625 |
| Price to Sales Ratio | N/A |
| Price to Book Ratio | N/A |
| Price to Cash Flow Ratio | N/A |
| Enterprise Value to EBITDA | N/A |
| Enterprise Value to Sales | N/A |
| Total Debt to Enterprise Value | N/A |
SSNLF Efficiency
| Revenue/Employee | N/A |
| Income Per Employee | N/A |
| Receivables Turnover | N/A |
| Total Asset Turnover | 0.632 |
SSNLF Liquidity
| Current Ratio | N/A |
| Quick Ratio | N/A |
| Cash Ratio | N/A |
SSNLF Profitability
| Gross Margin | N/A |
| Operating Margin | 13.07 |
| Pretax Margin | 14.832 |
| Net Margin | 13.551 |
| Return on Assets | 8.561 |
| Return on Equity | 11.181 |
| Return on Total Capital | N/A |
| Return on Invested Capital | N/A |
SSNLF Capital Structure
| Total Debt to Total Equity | N/A |
| Total Debt to Total Capital | N/A |
| Total Debt to Total Assets | N/A |
| Long-Term Debt to Equity | N/A |
| Long-Term Debt to Total Capital | N/A |
Samsung Electronics Co. Ltd. in the News
Apple projected to beat Samsung in smartphone shipments for first time since 2011
Shipments of iPhones are expected to surge 10% in 2025 as Apple reclaims smartphone leadership from Samsung, fueled by strong iPhone 17 series reception.
Samsung goes at Apple with Galaxy Watch Ultra, Galaxy Ring
Samsung said both of its new devices, the Galaxy Ring and Galaxy Watch Ultra, will officially hit the market on July 24 alongside the seventh iteration of its standard smartwatch.
Samsung's main union in South Korea to go on strike indefinitely
Samsung's largest union in South Korea announced it will continue its three-day strike indefinitely as it seeks larger pay raises amid an impasse in negotiations with management.
Former Apple CEO compares this 'extraordinary' new product to the invention of the iPhone
Former Apple CEO John Sculley joined FOX Business' 'The Claman Countdown' to sound off on the release of the Apple Vision Pro virtual reality headset.
Samsung unveiling 'new era of mobile AI,' S24 lineup during Galaxy Unpacked event
Samsung is expected to announce how artificial intelligence and their best-selling mobile phone S Series line are expected to merge during a live event Wednesday.
EU may struggle to catch up with U.S., Asia in chips subsidies race
The EU Chips Act aims to tempt top chipmakers to manufacture in the region, but modest budget could impede attempts to catch up with the markets US and Asia.
Apple to open new India stores in major commitment to world's 5th-largest economy
Apple CEO Tim Cook has put India squarely in focus for the company's plans moving forward as he looks to gain some distance from China after a troubling few years.
92% of women runners say they're concerned about safety during outdoor runs: survey
Adidas has released a new running safety survey that says most women around the world worry about their safety, potential attacks and harassment when they go on runs.
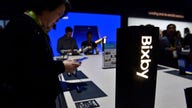
Samsung’s new Bixby feature allows users to clone their voice to respond to calls
Samsung's Bixby has released a new feature that allows users to create an AI-generate copy of their voice and tone by recording only a few sentences.
Samsung gets temporary OK on China chip facilities
Samsung Electronics has been granted an exception that will allow it to continue to temporarily maintain its memory-chip production facilities in China after the U.S. announced last week it’s tightening export controls to limit China’s ability to get advanced computing chips.


