About volkswagen ag - VWAGY
VWAGY At a Glance
| Phone | 49-5361-9-0 | Revenue | 351.18B | |
| Industry | Motor Vehicles | Net Income | 11.60B | |
| Sector | Consumer Durables | 2024 Sales Growth | 0.79% | |
| Fiscal Year-end | 12 / 2025 | Employees | 679,472 | |
| View SEC Filings |
VWAGY Valuation
| P/E Current | 8.469 |
| P/E Ratio (with extraordinary items) | N/A |
| P/E Ratio (without extraordinary items) | 4.125 |
| Price to Sales Ratio | 0.136 |
| Price to Book Ratio | 0.274 |
| Price to Cash Flow Ratio | 2.58 |
| Enterprise Value to EBITDA | 4.599 |
| Enterprise Value to Sales | 0.77 |
| Total Debt to Enterprise Value | 1.027 |
VWAGY Efficiency
| Revenue/Employee | 516,838.654 |
| Income Per Employee | 17,067.38 |
| Receivables Turnover | 3.038 |
| Total Asset Turnover | 0.508 |
VWAGY Liquidity
| Current Ratio | 1.169 |
| Quick Ratio | 0.908 |
| Cash Ratio | 0.312 |
VWAGY Profitability
| Gross Margin | 18.80 |
| Operating Margin | 7.513 |
| Pretax Margin | 5.061 |
| Net Margin | 3.302 |
| Return on Assets | 1.676 |
| Return on Equity | 6.594 |
| Return on Total Capital | 2.566 |
| Return on Invested Capital | 3.515 |
VWAGY Capital Structure
| Total Debt to Total Equity | 159.124 |
| Total Debt to Total Capital | 61.408 |
| Total Debt to Total Assets | 40.404 |
| Long-Term Debt to Equity | 89.636 |
| Long-Term Debt to Total Capital | 34.592 |
Volkswagen Ag in the News

Volkswagen recalls 271K Atlas SUVs over airbag issue
Until affected Volkswagen Atlas sport utility vehicles have received the fix, people should avoid sitting in the front passenger seat "whenever possible."
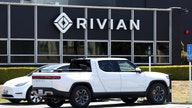
Volkswagen to invest $5B in Rivian, form joint venture
Volkswagen and Rivian said Tuesday they will create a joint venture together, with the electric vehicle startup expected to receive up to $5 billion from the German automaker.

Mercedes-Benz workers at Alabama plant slated for union vote in May
Workers at the Mercedes-Benz factory in Vance, Alabama, are scheduled to vote next month on whether to the join the United Auto Workers amid the union's organization push.
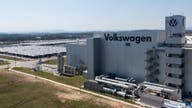
Union vote underway at Volkswagen's only US plant
Workers at Volkswagen's sole U.S. factory in Chattanooga, Tennessee, are voting this week on whether to join the United Auto Workers after rejecting the UAW twice before.
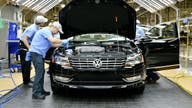
UAW moves to hold unionization vote at Volkswagen plant in Tennessee
The UAW announced that workers at the Volkswagen assembly plant in Tennessee will hold a vote on unionization after UAW auto workers at the Big Three secured a record contract.

Volkswagen, Audi recall over 261,000 vehicles to fix fuel leak, fire risk
Volkswagen is recalling over 261,000 VW and Audi vehicles in the U.S. and Canada to address a fuel pump leak that could create a fire hazard, NHTSA said on Thursday.

Imported luxury cars such as Audi held by US over banned part linked to forced labor in China
Thousands of luxury cars slated to be imported to the U.S. are being held by customs officials while Volkswagen replaces a part linked to forced labor in China's Xinjiang region.

Volkswagen brings ChatGPT into compact cars
Volkswagen announced that its integration of ChatGPT into its "IDA" voice assistant for drivers makes it the first volume manufacturer to make the AI chatbot a standard feature.

UAW accuses Honda, Hyundai and Volkswagen of union-busting
The United Auto Workers union says foreign automakers Honda, Hyundai and Volkswagen all engaged in unfair labor practices against workers seeking to unionize in U.S. shops.

GOP reps urge Ford, Tesla and other automakers to keep 'life-saving' AM radio in new models
Rep. Bob Latta, R-Ohio, and Rep. Greg Pence, R-Ind., press leading car manufacturers on the decision to remove AM radio from new models in a Fox News Digital exclusive.