About southwest airlines co. - LUV
LUV At a Glance
| Phone | 1-214-792-4000 | Revenue | 28.06B | |
| Industry | Airlines | Net Income | 442.00M | |
| Sector | Transportation | 2025 Sales Growth | 2.11% | |
| Fiscal Year-end | 12 / 2026 | Employees | N/A | |
| View SEC Filings |
LUV Valuation
| P/E Current | 66.468 |
| P/E Ratio (with extraordinary items) | N/A |
| P/E Ratio (without extraordinary items) | 52.178 |
| Price to Sales Ratio | 0.822 |
| Price to Book Ratio | 2.67 |
| Price to Cash Flow Ratio | 12.52 |
| Enterprise Value to EBITDA | 10.877 |
| Enterprise Value to Sales | 0.92 |
| Total Debt to Enterprise Value | 0.232 |
LUV Efficiency
| Revenue/Employee | 385,533.727 |
| Income Per Employee | 6,072.263 |
| Receivables Turnover | 24.424 |
| Total Asset Turnover | 0.841 |
LUV Liquidity
| Current Ratio | 0.517 |
| Quick Ratio | 0.446 |
| Cash Ratio | 0.296 |
LUV Profitability
| Gross Margin | 18.476 |
| Operating Margin | 1.525 |
| Pretax Margin | 2.006 |
| Net Margin | 1.575 |
| Return on Assets | 1.325 |
| Return on Equity | 4.822 |
| Return on Total Capital | 3.166 |
| Return on Invested Capital | 2.962 |
LUV Capital Structure
| Total Debt to Total Equity | 74.94 |
| Total Debt to Total Capital | 42.838 |
| Total Debt to Total Assets | 19.229 |
| Long-Term Debt to Equity | 66.972 |
| Long-Term Debt to Total Capital | 38.282 |
Southwest Airlines Co. in the News

Southwest to debut new Super Bowl ad, showcasing its 'self-aware' humor
Southwest's new assigned seating policy gets the Super Bowl treatment. The airline's new ad pokes fun at chaotic boarding days while attempting to embrace change.

Southwest Airlines officially ends longstanding open-seating model, begins plus-size pricing change
Southwest Airlines ends its famous open-seating policy and implements new rules requiring plus-size passengers to purchase extra tickets in advance.

Airlines have 580 million reasons to like GLP-1 weight-loss drugs, analysis finds
U.S. airline companies stand to save hundreds of millions each year from Americans losing weight thanks to GLP-1 drugs, according to a new study.
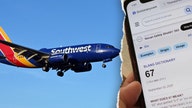
Southwest offering $67 flights in nod to viral internet meme: 'Trendy' sale
Southwest's viral "6-7" meme-inspired sale offers $67 flights, referencing the popular Gen Alpha trend from rapper Skrilla's hit song "Doot Doot (6 7)."

Airlines step up to support federal workers as nearly 13,000 air traffic controllers go unpaid
Major airlines are providing meals and support to unpaid air traffic controllers and TSA officers during the federal government shutdown.
Largest US airlines raise pressure on Dems to 'pass a clean CR' and end shutdown
Major U.S. airlines are calling on Congress to reopen the government as TSA workers and air traffic controllers are continuing to work without pay.

Southwest Airlines begins using FAA-mandated cockpit barriers on new Boeing jetliners
Southwest Airlines becomes the first carrier to fly a Boeing 737 Max 8 with new secondary flight deck barriers designed to prevent cockpit intrusions.

‘I felt violated': New mom alleges British Airways attendant lifted her nursing cover mid-flight
A California mom said a British Airways attendant lifted her nursing cover mid-flight, exposed her while breastfeeding, and dismissed her complaint with gift cards.
Southwest Airlines ditches decades-old open seating after years of holding out
Southwest Airlines' transition to assigned seating follows recent policy changes including the end of their bags fly free policy, prompting mixed reactions from passengers.

Southwest installs 'third set of eyes' in cockpit to boost safety
Southwest Airlines is outfitting its Boeing 737 fleet with new Honeywell software that alerts pilots to runway risks, aiming to prevent disaster before it happens.