About las vegas sands corp. - LVS
LVS At a Glance
| Phone | 1-702-923-9000 | Revenue | 13.02B | |
| Industry | Casinos/Gaming | Net Income | 1.63B | |
| Sector | Consumer Services | 2025 Sales Growth | 15.215% | |
| Fiscal Year-end | 12 / 2026 | Employees | N/A | |
| View SEC Filings |
LVS Valuation
| P/E Current | 24.23 |
| P/E Ratio (with extraordinary items) | N/A |
| P/E Ratio (without extraordinary items) | 27.698 |
| Price to Sales Ratio | 3.465 |
| Price to Book Ratio | N/A |
| Price to Cash Flow Ratio | N/A |
| Enterprise Value to EBITDA | N/A |
| Enterprise Value to Sales | N/A |
| Total Debt to Enterprise Value | N/A |
LVS Efficiency
| Revenue/Employee | 313,662.651 |
| Income Per Employee | 39,204.819 |
| Receivables Turnover | 17.543 |
| Total Asset Turnover | N/A |
LVS Liquidity
| Current Ratio | N/A |
| Quick Ratio | N/A |
| Cash Ratio | 0.91 |
LVS Profitability
| Gross Margin | 28.179 |
| Operating Margin | 23.731 |
| Pretax Margin | 17.001 |
| Net Margin | 12.499 |
| Return on Assets | N/A |
| Return on Equity | N/A |
| Return on Total Capital | N/A |
| Return on Invested Capital | N/A |
LVS Capital Structure
| Total Debt to Total Equity | N/A |
| Total Debt to Total Capital | N/A |
| Total Debt to Total Assets | 72.86 |
| Long-Term Debt to Equity | N/A |
| Long-Term Debt to Total Capital | N/A |
Las Vegas Sands Corp. in the News
NBA approves Mavericks' multibillion-dollar sale
The NBA on Wednesday approved Dr. Miriam Adelson's purchase of the Dallas Mavericks from Mark Cuban. The agreement is said to be worth about $3.5 billion.

Adelson, Dumont families excited for majority stake purchase of Mavericks: 'Future is bright'
The Adelson and Dumont families released a joint statement explaining their excitement to serve as governor of the Dallas Mavericks after entering "binding purchase agreements."

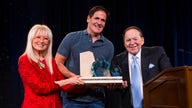
Mark Cuban to sell majority stake of Dallas Mavericks to billionaire Miriam Adelson: reports
Dallas Mavericks owner Mark Cuban will sell his majority stake in the team to billionaire casino magnate Miriam Adelson, according to multiple reports.

Nikki Haley met with GOP mega-donor casino magnate Miriam Adelson: report
Republican presidential candidate Nikki Haley reportedly held a meeting over the weekend with billionaire mega-donor Miriam Adelson as Haley looks to build momentum in her campaign.

Wynn, Las Vegas Sands shares hit on China’s Macau plans
China may step up surveillance of Wynn Resorts, Las Vegas Sands and other casinos doing business in the lucrative province of Macau.

Viva Las Business: Vegas reopens
Las Vegas is seeing excessive demand after a paltry 2020.