About boston scientific corp. - BSX
Boston Scientific Corp. engages in the development, manufacture, and marketing of medical devices that are used in interventional medical procedures. It operates through the MedSurg and Cardiovascular segments. The MedSurg segment includes Endoscopy, Urology, and Neuromodulation. The Cardiovascular segment consists of Cardiology and Peripheral Interventions. The company was founded by John E. Abele and Pete Michael Nicholas on June 29, 1979 and is headquartered in Marlborough, MA.
BSX At a Glance
Boston Scientific Corp.
300 Boston Scientific Way
Marlborough, Massachusetts 01752-1234
| Phone | 1-508-683-4000 | Revenue | 16.75B | |
| Industry | Medical Specialties | Net Income | 1.85B | |
| Sector | Health Technology | 2024 Sales Growth | 17.605% | |
| Fiscal Year-end | 12 / 2025 | Employees | N/A | |
| View SEC Filings |
BSX Valuation
| P/E Current | 40.021 |
| P/E Ratio (with extraordinary items) | N/A |
| P/E Ratio (without extraordinary items) | 71.622 |
| Price to Sales Ratio | 7.925 |
| Price to Book Ratio | 6.05 |
| Price to Cash Flow Ratio | 38.64 |
| Enterprise Value to EBITDA | 36.797 |
| Enterprise Value to Sales | 8.578 |
| Total Debt to Enterprise Value | 0.078 |
BSX Efficiency
| Revenue/Employee | 315,981.132 |
| Income Per Employee | 34,981.132 |
| Receivables Turnover | 6.547 |
| Total Asset Turnover | 0.449 |
BSX Liquidity
| Current Ratio | 1.081 |
| Quick Ratio | 0.642 |
| Cash Ratio | 0.082 |
BSX Profitability
| Gross Margin | 61.307 |
| Operating Margin | 15.734 |
| Pretax Margin | 13.626 |
| Net Margin | 11.071 |
| Return on Assets | 4.975 |
| Return on Equity | 9.032 |
| Return on Total Capital | 5.619 |
| Return on Invested Capital | 6.244 |
BSX Capital Structure
| Total Debt to Total Equity | 51.576 |
| Total Debt to Total Capital | 34.026 |
| Total Debt to Total Assets | 28.501 |
| Long-Term Debt to Equity | 43.036 |
| Long-Term Debt to Total Capital | 28.393 |
Boston Scientific Corp. in the News
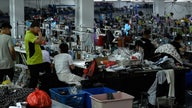
AI helping remove Chinese goods made with Uyghur forced labor from corporate supply chains
Altana Technologies developed an AI-informed supply chain mapping system used by Customs and Border Protection and a number of firms to root out Uyghur forced labor from supply chains.
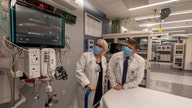
Medical-device makers gain amid return to normalcy
Many of the top large-cap device makers reported relatively rosy fourth-quarter earnings while issuing 2023 guidance that was above analyst expectations.