About keurig dr pepper inc. - KDP
Keurig Dr Pepper, Inc. engages in the manufacture, marketing, distribution, and sales of non-alcoholic beverages. It operates through the following segments: U.S. Refreshment Beverages, U.S. Coffee, and International. The U.S. Refreshment Beverages segment manufactures and distributes beverage concentrates, syrups, and finished beverages including the brands Dr Pepper, Canada Dry, Mott’s, Snapple, A&W, 7UP, Sunkist soda, Squirt, Hawaiian Punch, Core Hydration, Bai, C4 Energy, Clamato, Evian, Yoo-Hoo, Big Red, and Vita Coco. The U.S. Coffee segment involves single serve brewers, specialty, hot and iced varieties, and ready-to-drink beverages. The International segment includes sales in Canada, Mexico, and other markets. The company was founded in 2018 and is headquartered in Burlington, MA.
KDP At a Glance
Keurig Dr Pepper, Inc.
53 South Avenue
Burlington, Massachusetts 01803
| Phone | 1-781-418-7000 | Revenue | 15.35B | |
| Industry | Beverages: Non-Alcoholic | Net Income | 1.44B | |
| Sector | Consumer Non-Durables | 2024 Sales Growth | 3.625% | |
| Fiscal Year-end | 12 / 2025 | Employees | 29,400 | |
| View SEC Filings |
KDP Valuation
| P/E Current | 24.136 |
| P/E Ratio (with extraordinary items) | N/A |
| P/E Ratio (without extraordinary items) | 30.50 |
| Price to Sales Ratio | 2.863 |
| Price to Book Ratio | 1.797 |
| Price to Cash Flow Ratio | 19.81 |
| Enterprise Value to EBITDA | 14.094 |
| Enterprise Value to Sales | 3.952 |
| Total Debt to Enterprise Value | 0.285 |
KDP Efficiency
| Revenue/Employee | 522,142.857 |
| Income Per Employee | 49,013.605 |
| Receivables Turnover | 8.909 |
| Total Asset Turnover | 0.291 |
KDP Liquidity
| Current Ratio | 0.494 |
| Quick Ratio | 0.318 |
| Cash Ratio | 0.073 |
KDP Profitability
| Gross Margin | 52.146 |
| Operating Margin | 23.269 |
| Pretax Margin | 12.468 |
| Net Margin | 9.387 |
| Return on Assets | 2.73 |
| Return on Equity | 5.773 |
| Return on Total Capital | 3.467 |
| Return on Invested Capital | 3.809 |
KDP Capital Structure
| Total Debt to Total Equity | 71.423 |
| Total Debt to Total Capital | 41.665 |
| Total Debt to Total Assets | 32.407 |
| Long-Term Debt to Equity | 59.312 |
| Long-Term Debt to Total Capital | 34.60 |
Keurig Dr Pepper Inc. in the News

Keurig Dr Pepper to buy Peet's coffee owner in $18B deal
Keurig Dr Pepper will acquire Dutch firm JDE Peet's in an $18 billion deal and plans to split up its beverage and coffee units into two independent companies.
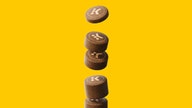
Keurig introduces new pod design that lacks one significant trait
Keurig Dr. Pepper has a single-serve Keurig coffee pod that doesn’t have any plastic in the pipeline. It is called the 'K-Round' and also doesn't have aluminum.
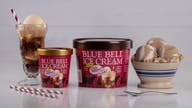
Dr. Pepper and Blue Bell team up to create brand-new ice cream flavor
Dr Pepper and Blue Bell have introduced a new ice cream flavor called Dr Pepper Float, which combines vanilla ice cream with a Dr Pepper-flavored sherbet, Blue Bell announced.