About unilever plc - UL
UL At a Glance
| Phone | 44-207-822-5252 | Revenue | 65.72B | |
| Industry | Household/Personal Care | Net Income | 6.21B | |
| Sector | Consumer Non-Durables | 2024 Sales Growth | 1.995% | |
| Fiscal Year-end | 12 / 2025 | Employees | 120,040 | |
| View SEC Filings |
UL Valuation
| P/E Current | 25.969 |
| P/E Ratio (with extraordinary items) | N/A |
| P/E Ratio (without extraordinary items) | 22.746 |
| Price to Sales Ratio | 2.163 |
| Price to Book Ratio | 6.788 |
| Price to Cash Flow Ratio | 14.40 |
| Enterprise Value to EBITDA | 12.193 |
| Enterprise Value to Sales | 2.569 |
| Total Debt to Enterprise Value | 0.188 |
UL Efficiency
| Revenue/Employee | 547,522.593 |
| Income Per Employee | 51,759.678 |
| Receivables Turnover | 9.942 |
| Total Asset Turnover | 0.793 |
UL Liquidity
| Current Ratio | 0.761 |
| Quick Ratio | 0.555 |
| Cash Ratio | 0.296 |
UL Profitability
| Gross Margin | 45.045 |
| Operating Margin | 18.393 |
| Pretax Margin | 14.177 |
| Net Margin | 9.453 |
| Return on Assets | 7.498 |
| Return on Equity | 30.535 |
| Return on Total Capital | 11.848 |
| Return on Invested Capital | 13.479 |
UL Capital Structure
| Total Debt to Total Equity | 153.352 |
| Total Debt to Total Capital | 60.529 |
| Total Debt to Total Assets | 38.439 |
| Long-Term Debt to Equity | 122.326 |
| Long-Term Debt to Total Capital | 48.283 |
Unilever Plc in the News

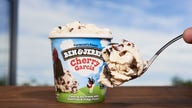
Ice cream brand scooping $8.85 million to customers in class action lawsuit – see if you qualify
Ice cream lovers who bought Breyers' Natural Vanilla ice cream between April 21, 2016, and Aug. 14, 2024, may be entitled to part of a multimillion-dollar class action settlement.

Artificial beauty: Warning of threats to girls’ self-esteem, Dove recommits to never using AI in ads
As experts predict that 90% of online content could be generated by artificial intelligence by 2025, a major beauty brand is taking a stand against the use of AI in advertising.
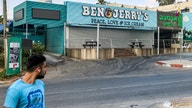
Problem child Ben & Jerry's getting boot from parent after years of political controversy
Unilever is finally getting rid of Ben & Jerry's after the progressive ice cream brand has given its parent company years of headaches with its controversial political activism.
Unilever to cut 7,500 jobs, spin off ice cream unit
Unilever announced Tuesday that its cutting jobs worldwide and plans to spin off one of its business units and slims down operations to drive productivity.
North Carolina latest to scoop retirement funds from Ben & Jerry’s over ice cream brand’s Israel boycott
North Carolina State Treasurer Dale Folwell announced that North Carolina Retirement Systems is withdrawing $40 million from Ben & Jerry's due to the company's Israel boycott.
Ben & Jerry's returns 'Free Cone Day' for first time since COVID pandemic
Ben & Jerrys has revived their Free Cone Day after 4 years. The Vermont-based company's tradition took a hiatus during the COVID-19 pandemic, but will offer free cones on April 3.
Lawyer for Ben & Jerry's Israel distributor says other corporations should 'take note' of Unilever decision
A lawyer for the Israeli distributor of Ben & Jerry's says that other corporations should "take note" of Unilever's decision to allow its distributor to continue selling the ice cream.
Ben & Jerry's corporate owner eyed by Israeli government, members of Congress
While ice cream is far from the most serious U.S. concern in the Middle East, a recent development in the Ben & Jerry’s saga in Israel could drive the push for a Securities and Exchange Commission investigation that members of Congress from both parties have sought.
Ben & Jerry's Israel boycott: Missouri leads 12 states urging parent company Unilever to reverse decision
Missouri Attorney General Eric Schmitt is leading 12 states in urging Ben & Jerry's parent company, Unilever, to reverse the ice cream maker's decision to boycott Israel.
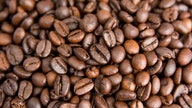
COVID-19 lockdowns in Asia deepen commodity supply-chain pain
The recent surge in COVID-19 cases in Southeast Asia has throttled ports and locked down plantations and processors, sparking extended disruptions of raw materials such as palm oil, coffee and tin.