About safran sa - SAFRY
Safran SA engages in the design, manufacture, and sale of aircraft, defense, and communication equipment and technologies. It operates through the following segments: Aerospace Propulsion, Aircraft Equipment, Defense, and Aerosystems, Aircraft Interiors. The Aerospace Propulsion segment designs, develops, produces, and markets propulsion and mechanical power transmission systems for commercial aircraft, military transport, training and combat aircraft, civil and military helicopters, and drones. The Aircraft Equipment, Defense, and Aerosystems segment covers the full life cycle of systems and equipment for civil and military aircraft and helicopters; and is involved in landing gear and brakes, nacelles and reversers, avionics, security systems, onboard computers, and fuel systems. The Aircraft Interiors segment engages in the manufacture of Cabin interiors for regional, medium-haul, long-haul, business and military aircraft. The Aircraft Interiors segment is composed of aircraft seats for passengers and crew, cabin equipment, overhead bins, class dividers, passenger service units, cabin interior solutions, chilling systems, galleys, electrical inserts and trolleys, and cargo equipment. The company was founded on August 16, 1924 and is headquartered in Paris, France.
SAFRY At a Glance
Safran SA
2, boulevard du Général Martial
Paris, Ile-de-France 75015
| Phone | 33-1-40-60-80-80 | Revenue | 29.98B | |
| Industry | Aerospace & Defense | Net Income | -721,487,734.47 | |
| Sector | Electronic Technology | 2024 Sales Growth | 17.25% | |
| Fiscal Year-end | 12 / 2025 | Employees | 99,364 | |
| View SEC Filings |
SAFRY Valuation
| P/E Current | 31.557 |
| P/E Ratio (with extraordinary items) | N/A |
| P/E Ratio (without extraordinary items) | N/A |
| Price to Sales Ratio | 3.049 |
| Price to Book Ratio | 8.687 |
| Price to Cash Flow Ratio | 17.85 |
| Enterprise Value to EBITDA | 17.116 |
| Enterprise Value to Sales | 3.017 |
| Total Debt to Enterprise Value | 0.058 |
SAFRY Efficiency
| Revenue/Employee | 301,720.351 |
| Income Per Employee | -7,261.058 |
| Receivables Turnover | 2.132 |
| Total Asset Turnover | 0.532 |
SAFRY Liquidity
| Current Ratio | 0.818 |
| Quick Ratio | 0.565 |
| Cash Ratio | 0.174 |
SAFRY Profitability
| Gross Margin | 14.663 |
| Operating Margin | 12.556 |
| Pretax Margin | -4.874 |
| Net Margin | -2.407 |
| Return on Assets | -1.28 |
| Return on Equity | -6.186 |
| Return on Total Capital | -4.574 |
| Return on Invested Capital | -4.366 |
SAFRY Capital Structure
| Total Debt to Total Equity | 49.705 |
| Total Debt to Total Capital | 33.202 |
| Total Debt to Total Assets | 9.194 |
| Long-Term Debt to Equity | 40.045 |
| Long-Term Debt to Total Capital | 26.749 |
Safran Sa in the News
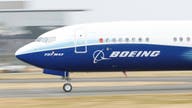
NTSB issues urgent safety bulletin about engines found in some Boeing 737 Max jets
The National Transportation Safety Board warned that certain CFM engines installed in some Boeing 737 Max jets may feed smoke into the cockpit or cabin after a bird strike.
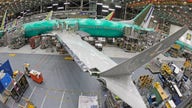
US to give aircraft companies $482M for pandemic
The Biden administration is making $482 million available to aviation industry manufacturers to help them avert job or pay cuts in the pandemic.

