About abbvie inc. - ABBV
AbbVie, Inc. is a research-based biopharmaceutical company, which engages in the development and sale of pharmaceutical products. It focuses on treating conditions such as chronic autoimmune diseases in rheumatology, gastroenterology, and dermatology, oncology, including blood cancers, virology, hepatitis C virus (HCV) and human immunodeficiency virus (HIV), neurological disorders, such as Parkinson's, metabolic, comprising thyroid disease and complications associated with cystic fibrosis, pain associated with endometriosis, and other serious health conditions. The company was founded on October 19, 2011 and is headquartered in North Chicago, IL.
ABBV At a Glance
AbbVie, Inc.
1 North Waukegan Road
North Chicago, Illinois 60064-6400
| Phone | 1-847-932-7900 | Revenue | 61.16B | |
| Industry | Pharmaceuticals: Major | Net Income | 4.23B | |
| Sector | Health Technology | 2025 Sales Growth | 8.567% | |
| Fiscal Year-end | 12 / 2026 | Employees | N/A | |
| View SEC Filings |
ABBV Valuation
| P/E Current | 95.96 |
| P/E Ratio (with extraordinary items) | N/A |
| P/E Ratio (without extraordinary items) | 95.863 |
| Price to Sales Ratio | 6.624 |
| Price to Book Ratio | N/A |
| Price to Cash Flow Ratio | N/A |
| Enterprise Value to EBITDA | N/A |
| Enterprise Value to Sales | N/A |
| Total Debt to Enterprise Value | N/A |
ABBV Efficiency
| Revenue/Employee | N/A |
| Income Per Employee | N/A |
| Receivables Turnover | N/A |
| Total Asset Turnover | N/A |
ABBV Liquidity
| Current Ratio | N/A |
| Quick Ratio | N/A |
| Cash Ratio | N/A |
ABBV Profitability
| Gross Margin | 83.707 |
| Operating Margin | 34.686 |
| Pretax Margin | 10.786 |
| Net Margin | 6.91 |
| Return on Assets | N/A |
| Return on Equity | N/A |
| Return on Total Capital | N/A |
| Return on Invested Capital | N/A |
ABBV Capital Structure
| Total Debt to Total Equity | N/A |
| Total Debt to Total Capital | N/A |
| Total Debt to Total Assets | N/A |
| Long-Term Debt to Equity | N/A |
| Long-Term Debt to Total Capital | N/A |
Abbvie Inc. in the News
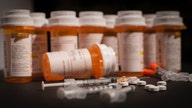
Drugmakers raised prices by 6.6% on average early this year
Drugmakers raised prices an average of 6.6% at the start of 2022.
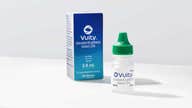
After FDA approval, first prescription eye drops to treat blurry near vision hit shelves
Vuity, which should be used once daily in each eye, works in as early as 15 minutes and provide up to 6 hours of sharper vision.

Biden pushes Congress to allow Medicare to negotiate drug prices
President Biden is set to lay out his vision Thursday for reducing the high cost of prescription drugs, and is expected to push Congress to pass legislation that would allow Medicare to negotiate drug prices for millions of Americans.

Warren Buffett's Berkshire Hathaway shakes up investment holdings
Warren Buffett's Berkshire Hathaway cut back on financial, energy and drug stocks but beefed up its grocery and wireless holdings while adding an insurer.