About molson coors beverage co. - TAP
TAP At a Glance
| Phone | 1-303-279-6565 | Revenue | 11.63B | |
| Industry | Beverages: Alcoholic | Net Income | 1.12B | |
| Sector | Consumer Non-Durables | Employees | 16,800 | |
| Fiscal Year-end | 12 / 2025 | |||
| View SEC Filings |
TAP Valuation
| P/E Current | N/A |
| P/E Ratio (with extraordinary items) | N/A |
| P/E Ratio (without extraordinary items) | 10.719 |
| Price to Sales Ratio | 1.035 |
| Price to Book Ratio | 0.89 |
| Price to Cash Flow Ratio | 6.30 |
| Enterprise Value to EBITDA | 6.894 |
| Enterprise Value to Sales | 1.529 |
| Total Debt to Enterprise Value | 0.357 |
TAP Efficiency
| Revenue/Employee | 692,083.333 |
| Income Per Employee | 66,809.524 |
| Receivables Turnover | 13.794 |
| Total Asset Turnover | 0.443 |
TAP Liquidity
| Current Ratio | 0.935 |
| Quick Ratio | 0.696 |
| Cash Ratio | 0.318 |
TAP Profitability
| Gross Margin | 37.244 |
| Operating Margin | 15.647 |
| Pretax Margin | 12.927 |
| Net Margin | 9.653 |
| Return on Assets | 4.281 |
| Return on Equity | 8.539 |
| Return on Total Capital | 5.772 |
| Return on Invested Capital | 5.901 |
TAP Capital Structure
| Total Debt to Total Equity | 48.534 |
| Total Debt to Total Capital | 32.675 |
| Total Debt to Total Assets | 24.379 |
| Long-Term Debt to Equity | 47.932 |
| Long-Term Debt to Total Capital | 32.27 |
Molson Coors Beverage Co. in the News

Alcohol maker stocks see declines in wake of Surgeon General cancer advisory
Popular alcohol producers had a bumpy morning as investors reacted to an advisory from the U.S. Surgeon General about alcohol and cancer.

Molson Coors scraps 'woke' DEI policies in growing trend among US companies
American beer giant Molson Coors on Tuesday informed employees it has rolled back some of its diversity, equity and inclusion (DEI) policies, becoming the latest U.S. company to do so.

Teamsters call for nationwide boycott of Molson Coors amid labor dispute
The Teamsters union is calling for a nationwide boycott of Molson Coors amid stalled talks with striking workers, asking that beer drinkers switch to Anheuser-Busch products.
Teamsters target Bud Light parent Anheuser-Busch, Molson Coors
The Teamsters union is striking at Molson Coors' Texas brewery and threatening to strike at all 12 U.S. Anheuser-Busch breweries as it remains locked in contract negotiations.
Texas Molson Coors brewery workers prepare to strike, potentially impacting several major beverage brands
More than 400 workers are preparing to walk off the job from a Texas brewery after they say negotiations for higher pay, and benefits have stalled.
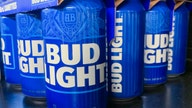
Bud Light sales down nearly 30% year over year as rivals continue to climb
Sales of Anheuser-Busch's beleaguered Bud Light brand are down 29.9% on an annual basis while competitors continue to gain ground following last year's boycott.

Beer brand offers fans $500 to be featured in ‘chill train’ Super Bowl LVIII campaign ad
A beer brand is offering fans the chance to be in a Super Bowl commercial while getting paid $500. The Coors Light Chill Train is back for the 2024 big game.
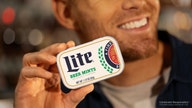
Miller Lite selling beer mints in move embracing Dry January
Miller Lite said Tuesday the 40-piece tins of Beer Mints will hit the market in two tranches of online sales. They were inspired by Dry January participants.
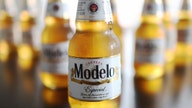
Modelo parent still reaping benefits from Bud Light controversy
Constellation Brands' beer business continues to gobble up market share in the U.S. after its Modelo Especial took over Bud Light as the top-selling beer last year.
Corona Light, Coors Light gain traction over Bud Light
Anheuser-Busch InBev beer brands have seen sales slip in the wake of the controversy involving Bud Light, with light beer rivals Coors Light, Miller Lite and Corona Light making gains.